Figure 6.
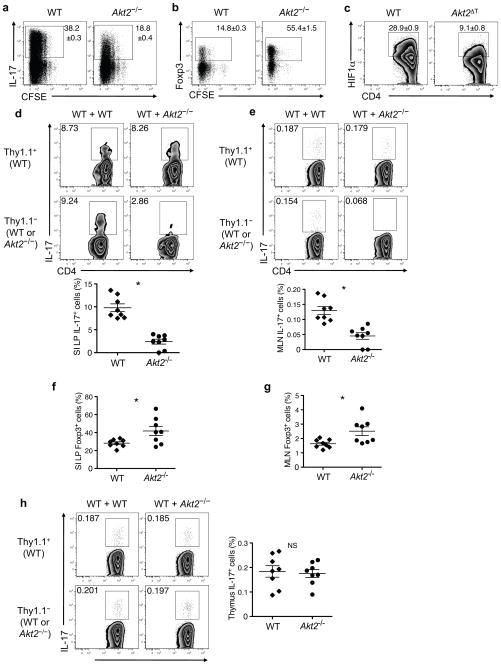
Akt2 regulates iTH17 and iTreg cells in a cell-intrinsic manner. (a) CFSE dilution and production of IL-17 in WT and Akt2−/−CD4+ T cells cultured with anti-CD3 plus anti- CD28 in iTH17-polarizing condition for 3 days followed by restimulation with PMA/ionomycin. (b) CFSE dilution and expression of Foxp3 of WT and Akt2−/− CD4+ T cells cultured with anti-CD3 plus anti-CD28 in iTreg-polarizing condition for 3 days. (c) Expression of intracellular HIF1α in WT and Akt2ΔT CD4+ T cells cultured with anti- CD3 plus anti-CD28 in iTH17-polarizing condition for 3 days. Flow plots are gated on CD4+ T cells and numbers represent mean ± SEM of IL-17+ cells from triplicate samples. Data are representative of at least three independent experiments using Akt2−/− or Akt2ΔT mice (a–c). (d) IL-17 producing small intestinal (SI) LP cells from mixed BM chimeras following ex vivo stimulation. Representative flow plots are gated on CD4+CD3+TCRβ+ cells showing the percent of IL-17A+ cells among Thy1.1+ or Thy1.1− populations. The graph shows pooled data representing the proportion of IL-17+ iTh17 cells among CD4+ T cells of either WT (Thy1.1+)- or Akt2−/−(Thy1.1− CD45.2+)-origin from WT+Akt2−/− mixed BM chimeras into CD45.1+ hosts, *P<0.0001. (e) IL-17 producing mesenteric lymph node (MLN) cells from mixed BM chimeras following ex vivo stimulation. Representative flow plots are gated on CD4+CD3+TCRβ+ cells showing the percent of IL-17+ cells among Thy1.1+ or Thy1.1− populations. Graph shows pooled data representing the proportion of IL-17+ cells among CD4+ T cells of either WT (Thy1.1+)-or Akt2−/−(Thy1.1− CD45.2+)-origin from WT+Akt2−/− mixed BM chimeras, *P=0.0002. Foxp3 expression in SI LP cells (f) or MLN cells (g) from mixed BM chimeras. (f,g) Graphs show pooled data representing the proportion of Foxp3+ Treg cells among CD4+ T cells of either WT (Thy1.1+)- or Akt2−/−(CD45.2+)-origin from WT+Akt2−/− mixed BM chimeras, *P=0.0241 in (f) and *P=0.0166 in (g). (h) IL-17 producing thymocytes from mixed BM chimeras following ex vivo stimulation. Representative flow plots are gated on CD4SPTCRβ+TCRγδ− thymocytes showing the percent of IL-17+ cells among Thy1.1+ or Thy1.1− populations. The graph shows pooled data representing the proportion of IL-17+ nTH17 cells among CD4SP cells of either WT (Thy1.1+)- or Akt2−/−(CD45.2+)-origin from WT+Akt2−/− mixed BM chimeras. NS, not significant. Mean ± SEM; P value from two- tailed Student’s t-test. Data are from two independent experiments with n = 3–5 mice per group in each experiment (d–h).

