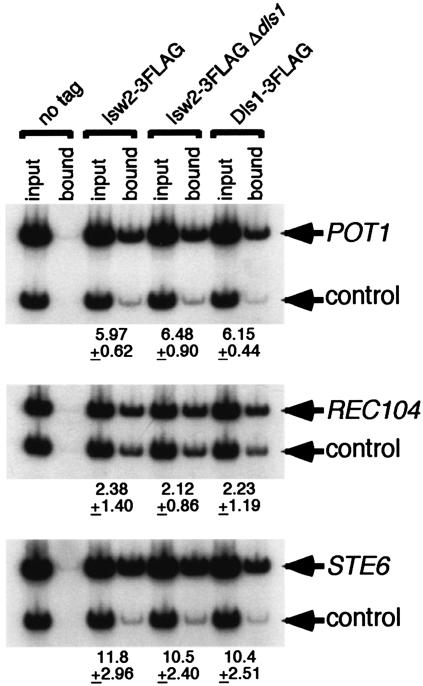
FIG. 5.
CHIP analysis of Isw2p and Dls1p. The relevant genotypes of the strains are shown on the top. The numbers indicate the averages and standard deviations of the CHIP signals at each locus relative to those at a control (YPL025C) locus. See Materials and Methods for the selection of the YPL025C locus as a control locus. As a control 100-fold (POT1 and STE6)- or 400-fold (REC104)-diluted input DNA from each strain was used.

