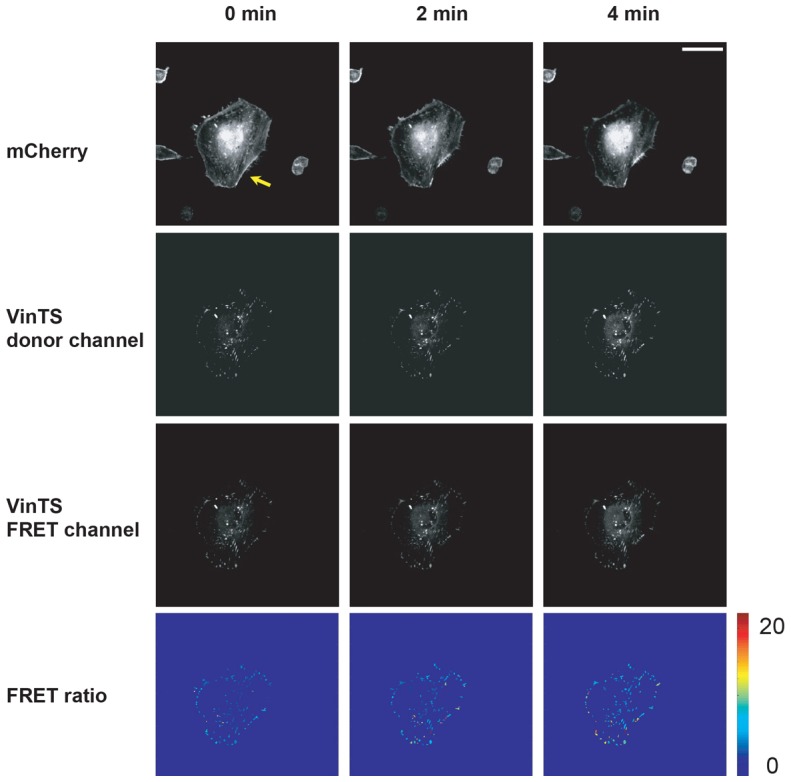
Fig. 1.

Mapping tension distributions of single stress fibers. The panels depict representative mCherry-Lifeact (top row), vinculin tension sensor (VinTS) donor (second row), VinTS FRET (third row), and FRET ratio (bottom row) images immediately before (0 min) and after (2 min and 4 min) laser ablation. The SF ablation site is indicated by the arrow in the mCherry image at 0 min. In the FRET ratio maps, all vinculin signal outside of the FAs depicted was masked out to facilitate analysis (see the Materials and Methods). The hotspots in the FRET ratio maps depict regions of increased FRET ratios following SF ablation, reflecting tension reduction. The contrast and brightness of all fluorescence images were optimized for clarity of presentation (see the Materials and Methods). Scale bar: 50 µm.
