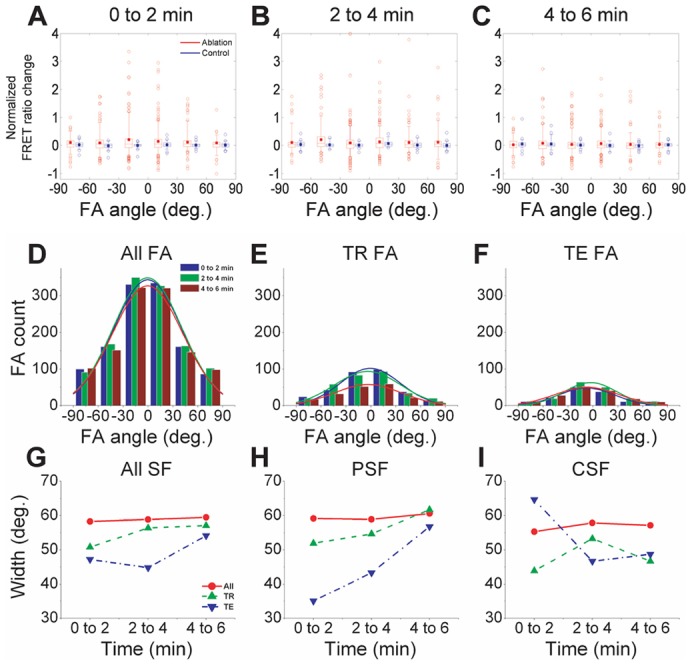
Fig. 4.

SFs distribute tension to FAs in an angle-dependent manner. (A–C) Distributions of normalized FRET ratio changes in individual FAs following SF ablation. The FRET ratio changes were calculated from 2-image FA tracking (Fig. 2C) over the indicated time intervals, and then plotted as a function of the angle between FA long axis and the reference axis (SF axis for ablated cells and cell long axis for non-ablated controls, as shown in Fig. 3A). The corresponding central and peripheral SF-ablation subpopulations are shown in supplementary material Fig. S8. The FRET ratio changes were normalized to the corresponding FRET ratio at the first time point of each two-minute interval. The horizontal box lines indicate 25th, 50th and 75th percentiles, the whisker ends indicate 5th and 95th percentiles, and the solid dots indicate mean values. Each data point represents one FA. (D–F). Time-dependent histograms of angles between FA and SF orientations for (D) all FAs, (E) tension-reduced (TR) FAs, and (F) tension-enhanced (TE) FAs. The curves are the corresponding Gaussian curve fits. The histograms for central and peripheral SF-ablation subpopulations are shown in supplementary material Fig. S9. (G–I). Breadth of tension distributions as a function of time and SF location. (G) Gaussian widths for all FAs, with the red, green, and blue curves (all, tension-reduced, and tension-enhanced) corresponding to the Gaussian fits shown in D–F, respectively. (H,I) Gaussian widths for (H) peripheral SF (PSF) and (I) central SF (CSF) subpopulations.
