Fig. 1.
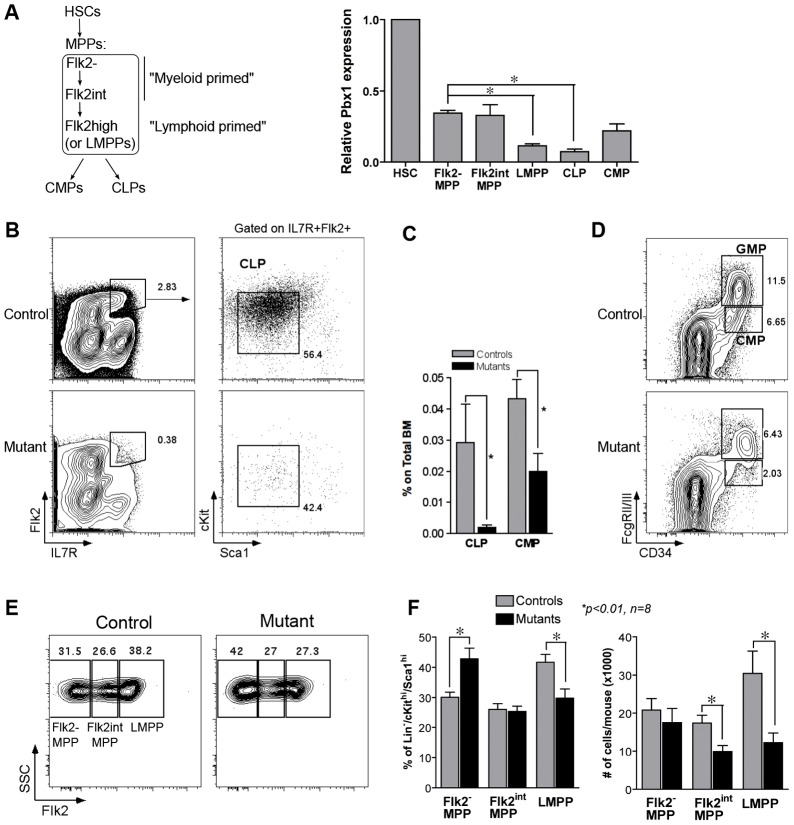
Evaluation of multi-potent progenitors in Pbx1-conditional knockout mice. (A) HSCs and progenitors indicated on the left were prospectively isolated by FACS from pooled BM of adult wild-type mice prior to RNA purification. The histogram shows Pbx1 transcript levels relative to HSCs as measured by real-time PCR (3–4 biological replicates, each performed in duplicate; *P<0.01). Expression levels of all progenitor subsets were significantly different from HSCs (P≤0.03). MPPs are defined as Lin−/cKithi/Scahi CD34+, divided into three fractions according to Flk2 expression: Flk2− MPPs, previously called short-term HSCs, Flk2-intermediate MPPs (Flk2int) and Flk2high MPPs or LMPPs. (B) Representative FACS analysis of CLPs from control (Tie2Cre−.Pbx1+/f) or mutant (Tie2Cre+.Pbx1−/f) mice. Contour plots on the left are referred to the Lin− gate. Percentages are relative to the parent gate. (C) Quantitative data from FACS analysis shown in B and D. Histograms represent the average CLP and CMP percentage within the BM of control or mutant mice (n = 14 and 15, respectively; *P<0.05). (D) Representative FACS analysis of CMPs and GMPs from control or mutant mice. Contour plots are referred to the Lin−cKit+Sca1− gate. Percentages are relative to the parent gate. (E) Representative FACS analysis is shown for MPPs from control or mutant mice, relative to the Lin−/cKithi/Scahi gate. (F) Histograms show the percentage of Flk2-negative, Flk2-intermediate and Flk2-high MPPs within the Lin−/cKithi/Scahi gate (left; qualitative plots are shown in E) or their absolute numbers per mouse (right); *P = 0.01, n = 8. Note that the mean fluorescence intensity was similar in mutants and controls, indicating that the reduction in progenitor subpopulations was not due to altered expression of the markers used to define them.

