
Fig. 3.
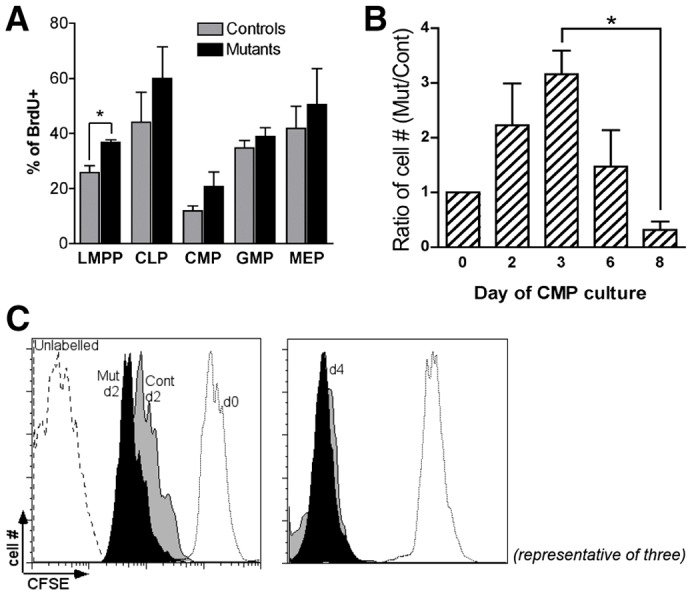
Altered progenitor proliferation. (A) Bar graph shows the percentage of BrdU+ cells in vivo within the indicated progenitor compartments (two independent experiments; average of three mutants and four controls, *P<0.02). (B) Prospectively isolated CMPs (2000–10,000 cells) were placed in liquid culture in the presence of cytokines. The graph shows the ratio of Pbx1-null cell number versus control at different time points (n = 3, *P = 0.003). (C) Prospectively isolated CMPs were labeled with CFSE immediately after sorting and cultured for 2 or 4 days. FACS analysis was performed immediately after labeling (d0), or at the indicated time points after plating. Histograms are representative of two independent experiments (n = 3).