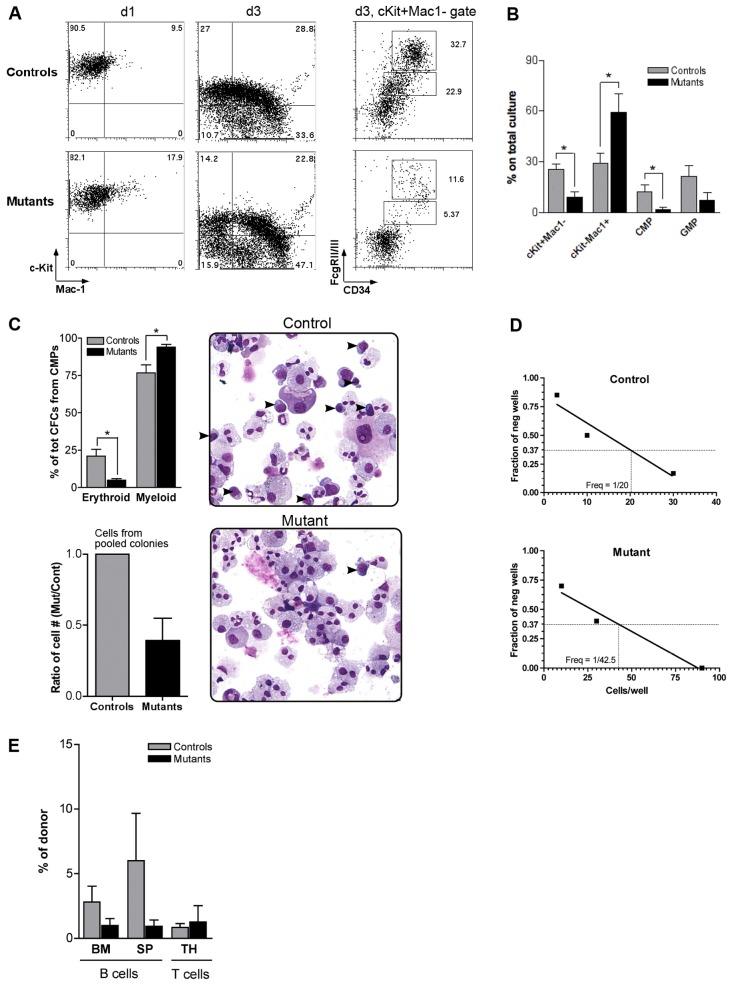
Fig. 4.
Premature differentiation of Pbx1-null lineage-restricted progenitors. (A) FACS analysis (representative of five) is shown for the progeny of CMPs prospectively isolated from control or mutant mice. Dot plots on the right are relative to the c-Kit+Mac-1− gate at day 3. (B) Histograms summarize data shown in A, day 3 (n = 5, *P<0.05). (C) Methylcellulose colony assay from prospectively isolated CMPs. The top and bottom histograms represent the average of four and two independent assays, respectively, each performed in duplicate (*P≤0.02). Once scored, colonies were pooled, counted (bottom histogram), cytospun and stained with May-Grunwald and Giemsa. Arrowheads on cytospin images indicate blast-like, not terminally differentiated cells (number of blast-like cells per field was 11.5±1.25 and 1.2±0.57 in control and mutant, respectively; n = 10, P<0.0001). Pictures were taken using a Nikon ECLIPSE E1000M microscope equipped with SPOT advanced software, using a 20× magnification. (D) Limiting dilution analysis (representative of two) of the frequency of control or mutant CLPs able to develop into CD19+ B cells, as shown in Fig. 2D (R2 = 0.92 and 0.96, respectively). (E) Bar graph shows average % of donor-derived cells within B lymphocytes in bone marrow (BM) or spleen (SP), and within T cells in the thymus (TH), 1 week after transplant of control or mutant CLPs (three recipient mice analyzed per group; two different donors).

