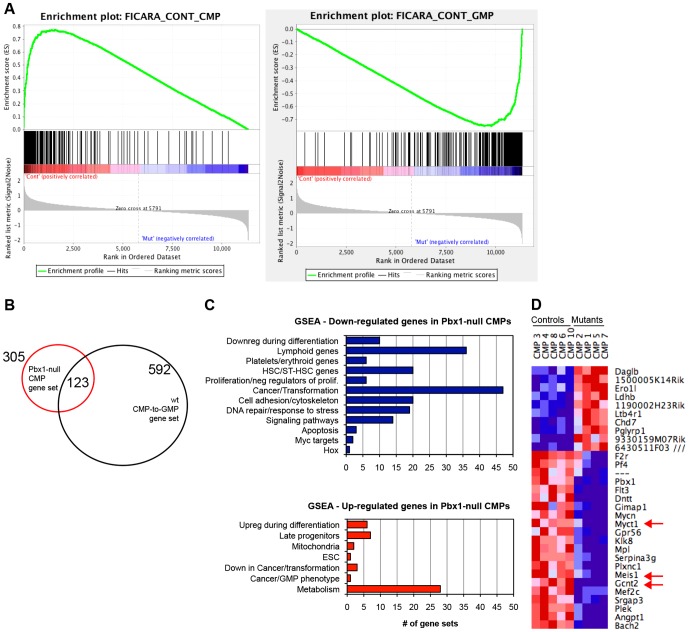
Fig. 5.
Pbx1 deficiency leads to derepression of GMP genes in CMPs. (A) GSEA plots show enrichment of the gene set characteristic of the normal CMP-to-GMP transition in the Pbx1-null CMP transcriptome. Transcripts downregulated in Pbx1-null CMPs positively correlate with typical CMP genes (left panel, FDR q-value 0), and negatively correlate with typical GMP genes (right panel, FDR q-value 0). (B) Venn diagram shows overlapping gene expression among Pbx1-null CMPs and the normal CMP-to-GMP transition. (C) Bar graphs shows the number of gene sets belonging to different functional groups that are enriched in Pbx1-null CMP downregulated (in blue) and upregulated (in red) transcripts. Gene sets with FDR q-value <0.2 and Nominal P≤0.05 were considered significantly enriched. (D) Heat map shows the expression of the top 31 differentially regulated transcripts between control and mutant CMPs, whose level of expression changed at least threefold between the two groups. Red arrows indicate genes that were also downregulated in Pbx1-null HSCs (Ficara et al., 2008).

