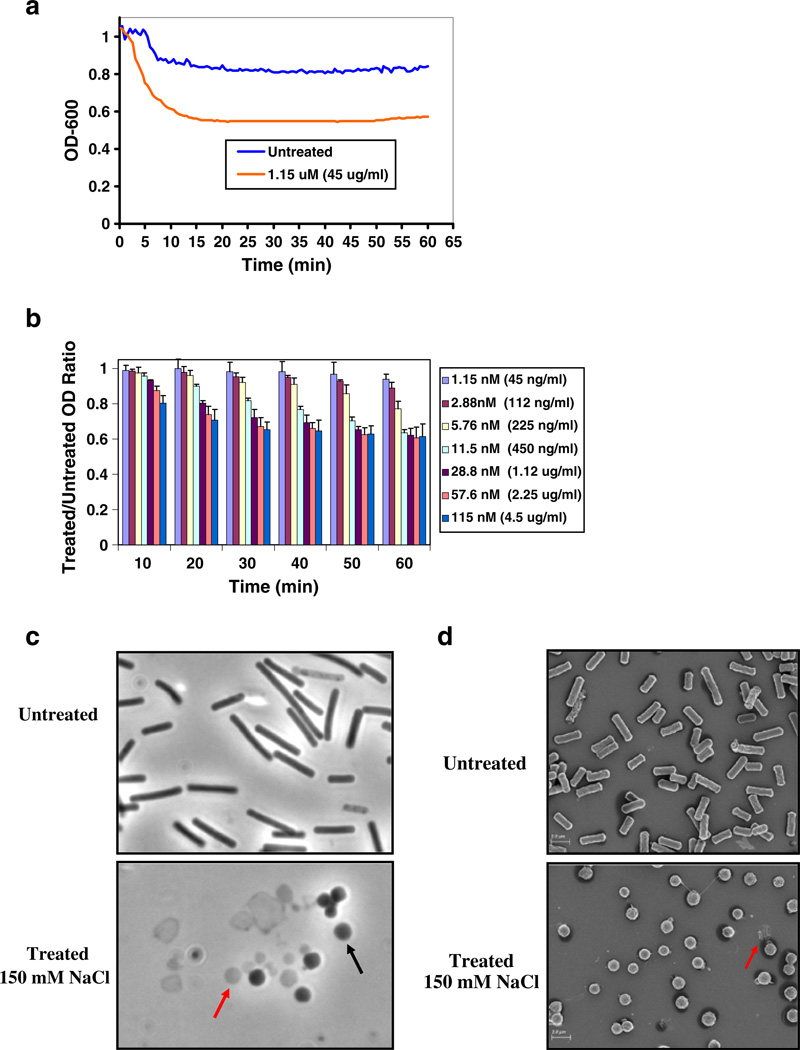
Fig. 7.
a Time course. A single lytic time course is shown with 1.15 mM PlyCM (45 µg/ml) and buffering conditions that include 150 mM NaCl (pH=6.4). b Variable lysin concentration. The experiment in Fig. 4b was repeated, again with the addition of 150 mM NaCl in the lysis buffer (for B, n=3). The clostridia responded to PlyCM at nearly identical concentrations as in 4b, except that the OD would fall to a maximum of 60% the untreated value. c The image compares (×1,000 magnification, phase contrast) the gross morphology of untreated ATCC 13124 with that of cells treated with lysin for 1 h in the presence of 150 mM NaCl. Within the treated samples, there exists a combination of collapsed spheroplasts (black arrow) that have maintained their cytoplasmic contents and contribute to optical density, as well as clostridial ghosts and ghost-fragments (red arrow) that have undergone complete lysis. d Scanning electron microscopy was also conducted on treated and untreated ATCC 13124 cells. The treated image is dominated by clostridial spheroplasts; a presumptive ghost is denoted with the red arrow

