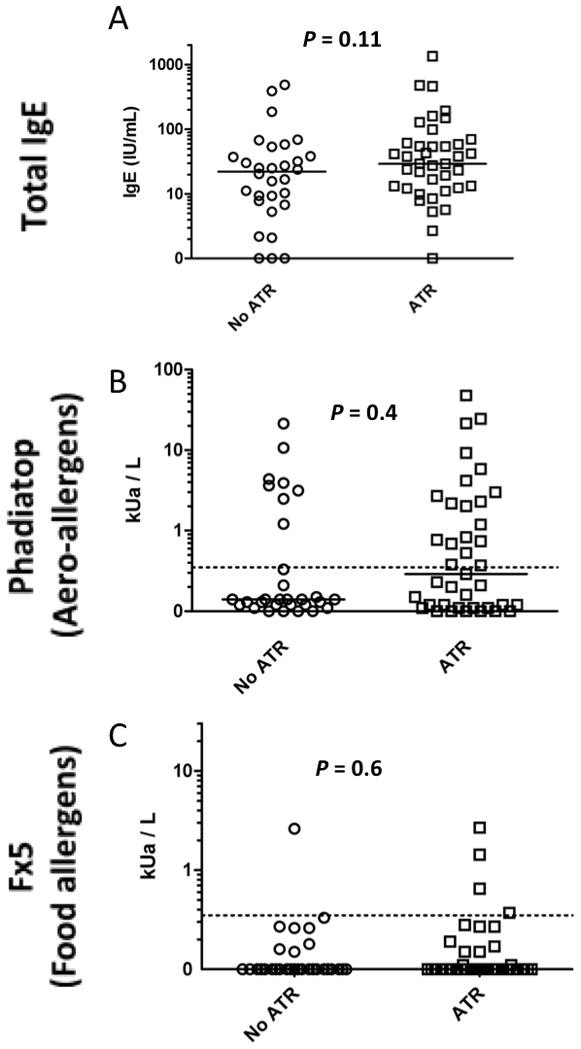
Figure 2. Total and allergen-specific IgE in apheresis platelet products.

Total serum IgE and allergen-specific IgE, as measured by Phadiatop (aero-allergens) and Fx5 (food allergens) are compared between apheresis platelet products that were (n=31) or were not (n=30) implicated in an ATR. Dashed lines represent the threshold for positivity in Phadiatop and Fx5 analyses. Bars represent median values.
