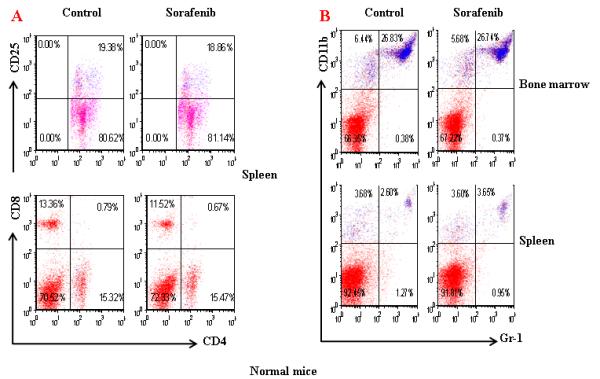
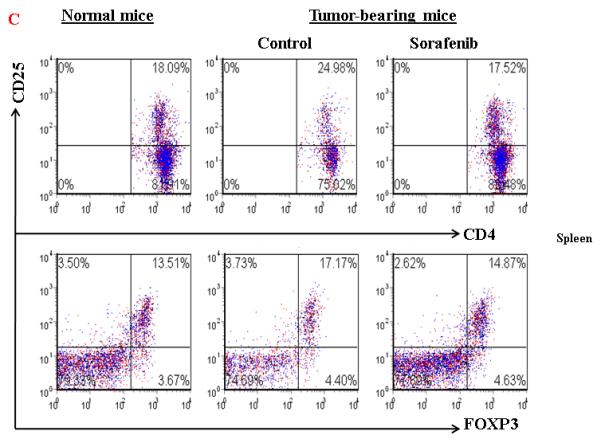
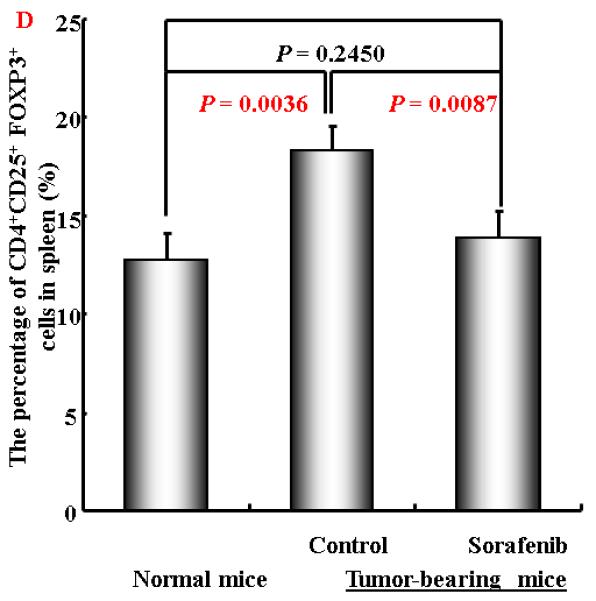
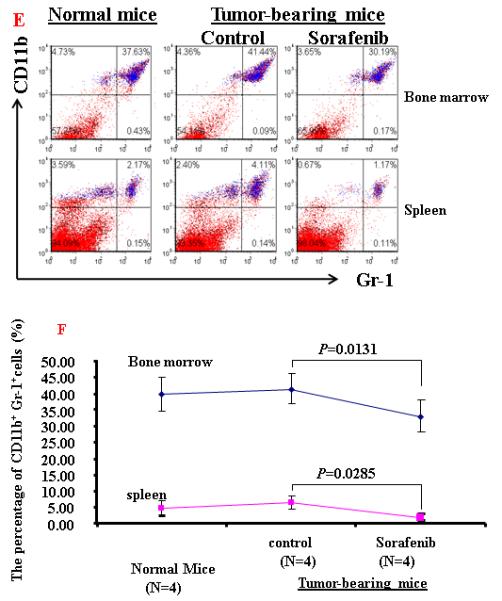
Figure 4. Sorafenib treatment significantly decreased the percentage of CD4+CD25+ T cells and CD11b+ cells in tumor-bearing mice.


A and B. A representative of flow cytometry data showing the frequency of CD4+CD25+ T cells and CD11b+Gr-1+ cells in spleens and bone marrow from normal mice or tumor-bearing mice treated with solvent or sorafenib; C and D. A representative (C) and collective ( D, n=3) of flow cytometry data showing the expression of FOXP3 in CD4+CD25+ T cells in spleens from normal mice or tumor-bearing mice treated with solvent or sorafenib; E. A representative of flow cytomrtey data showing the frequency of CD11b+ Gr-1+cells in bone marrow (upper panel) and spleen (lower panel) from normal mice or tumor-bearing mice treated with solvent or sorafenib; F. Mean CD11b+ Gr-1+ cells frequency bone marrow and spleen from normal and HCC tumor-bearing mice treated with solvent or sorafenib (n=5) . Data represent the mean ± SD of 3 or 5 mice per group from one representative experiment of two similar experiments.
