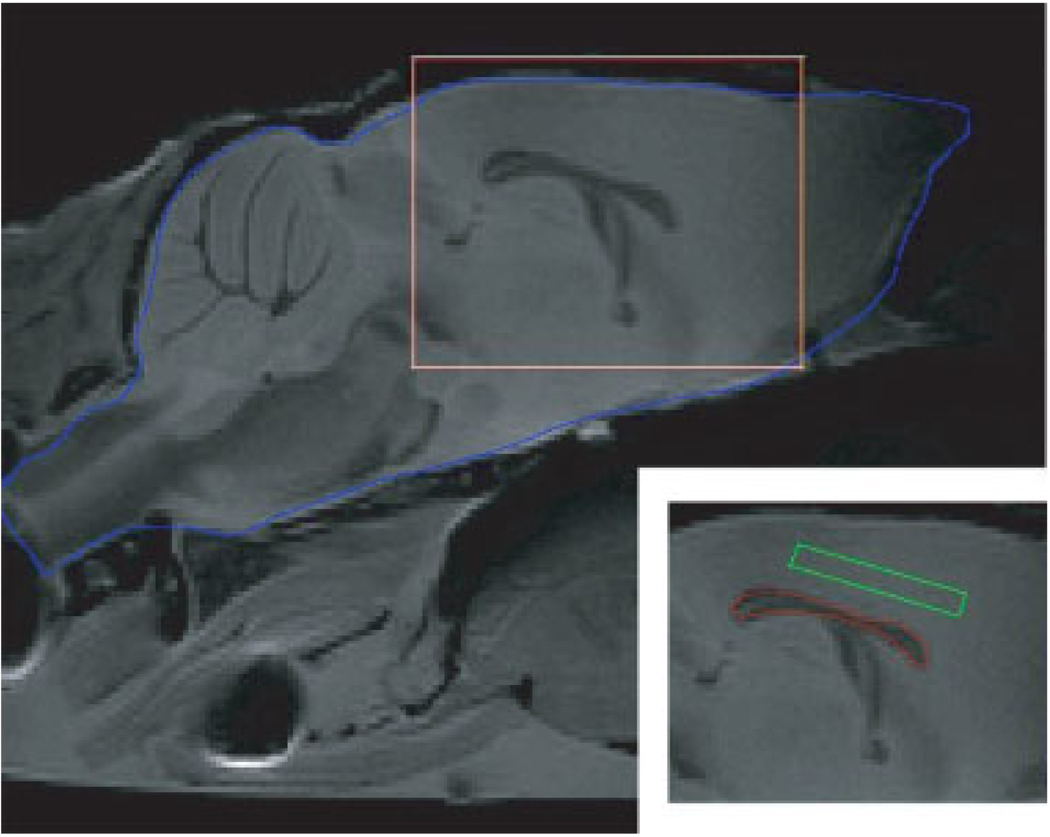
Figure 1.
The T2 weighted MRI for a mid-sagittal slice of a fixed control mouse head. The brain of the mouse is sketched by the blue line. The subfigure in the bottom right corner shows the rectangular area in the main figure, and with the ROIs for white matter (red) and gray matter (green) sketched. For each mouse, we chose the whole corpus callosum (50–60 pixels, without boundary pixels) as the ROI of white matter, and chose a rectangle (about 50–60 pixels) in the cortical gray matter superior to the corpus callosum as the ROI of gray matter.

