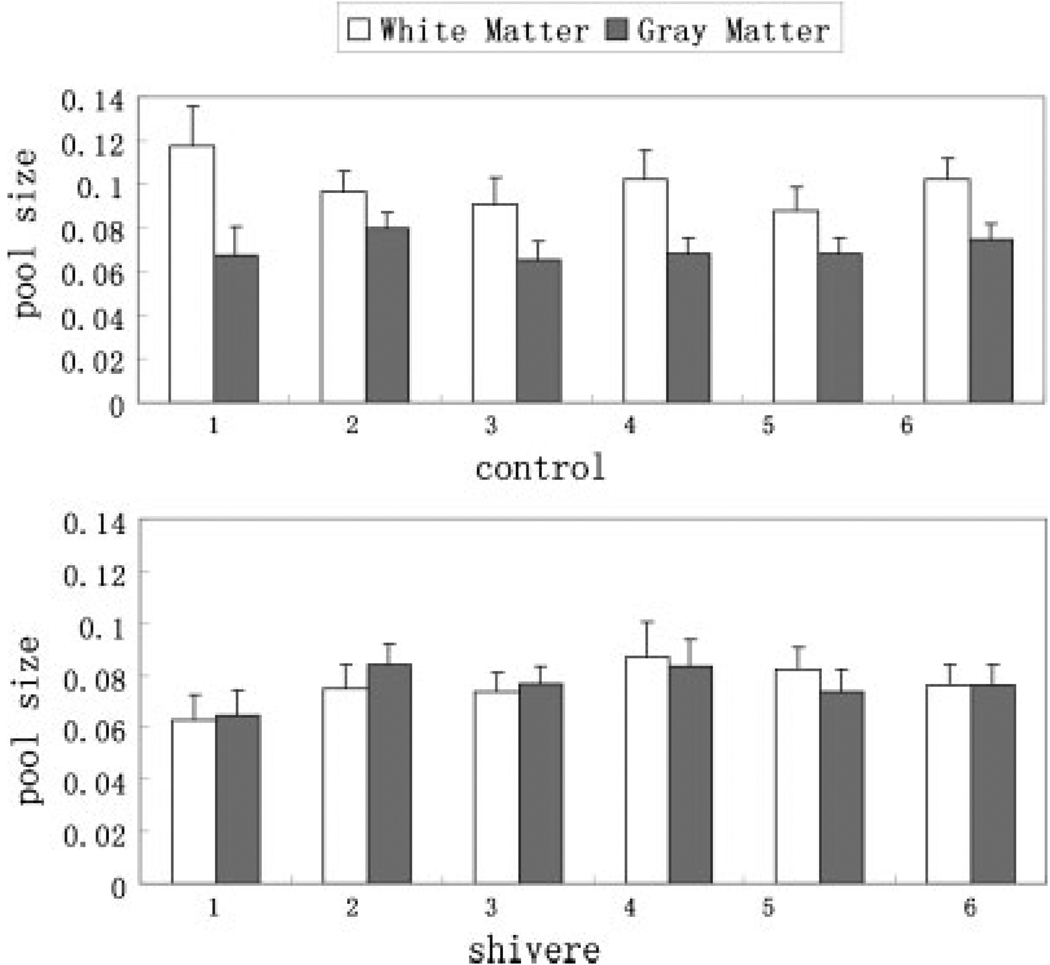
Figure 3.
Comparison of the pool size ratio in the white matter to that in the gray matter for all control (white matter: 0.099 ± 0.011, gray matter: 0.071 ± 0.005) and shiverer (white matter: 0.076 ± 0.008, gray matter: 0.076 ± 0.007) mice. The error bars represent the pixel-wise standard deviations in the ROIs. The pool size ratio in the white matter is higher than that in the gray matter for the control mice, while it is about the same for the shiverer mice. This figure is available in colour online at www.interscience.wiley.com/journal/nbm

