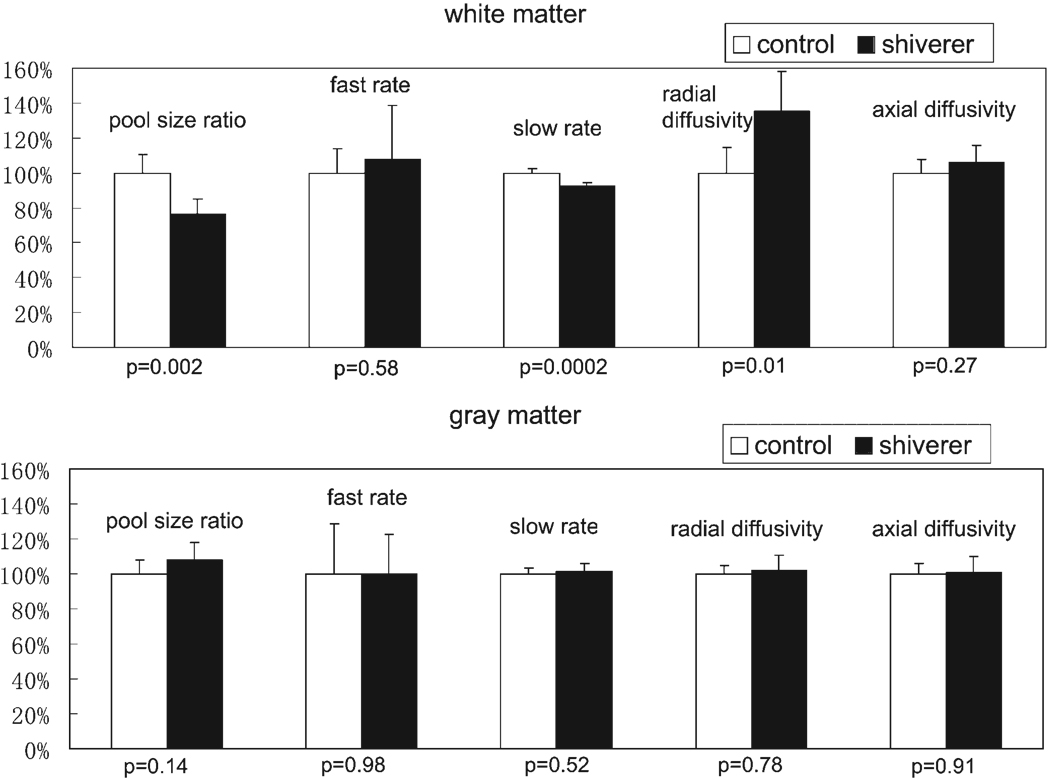
Figure 4.
The percentage differences of qMT and DTI parameters between control mice and shiverer mice. The parameters for control mice were set to 100%. The error bars represent the mouse-wise standard deviations. The p-values for statistical significance are also listed on the figure. The pool size ratio and radial diffusivity are different between the control and shiverer mice in the white matter, while they are similar in the gray matter.

