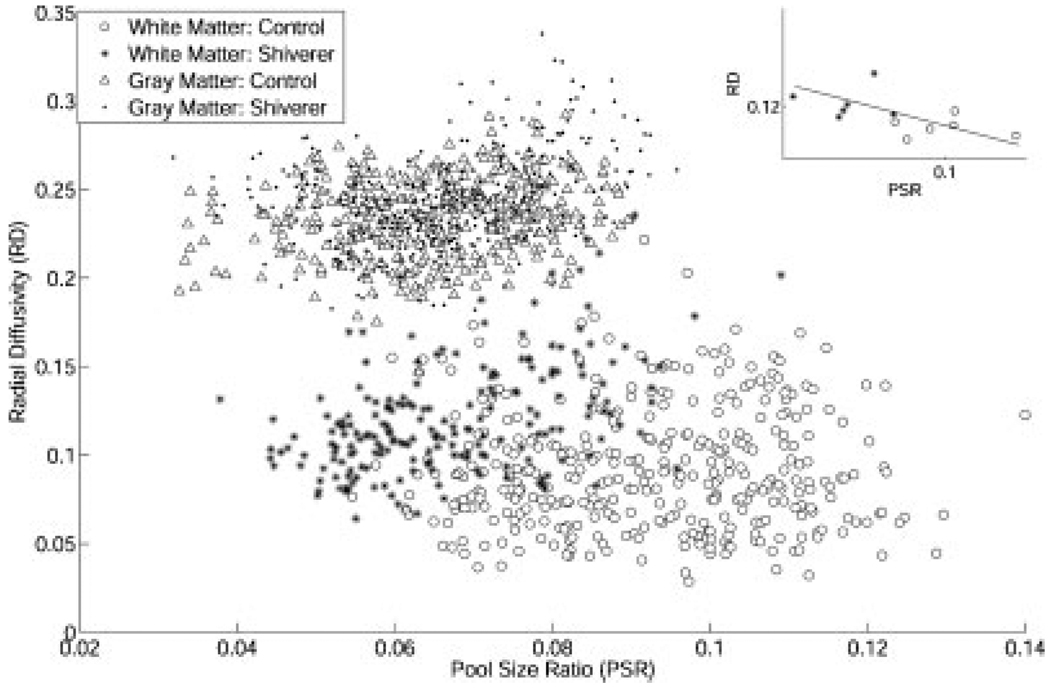
Figure 5.
The scatter plot for the measured pool size ratio and radial diffusivity for all ROI pixels. In the white matter, the control mice pixels were separated from the shiverer mice pixels by higher pool size ratio and smaller radial diffusivity; in the gray matter, the control mice pixels are not separated from the shiverer mice pixels. The subplot shows the correlation (r = −0.57, p = 0.025) between the pool size ratio and radial diffusivity in the white matter when the average data of each mouse is used as a data point.

