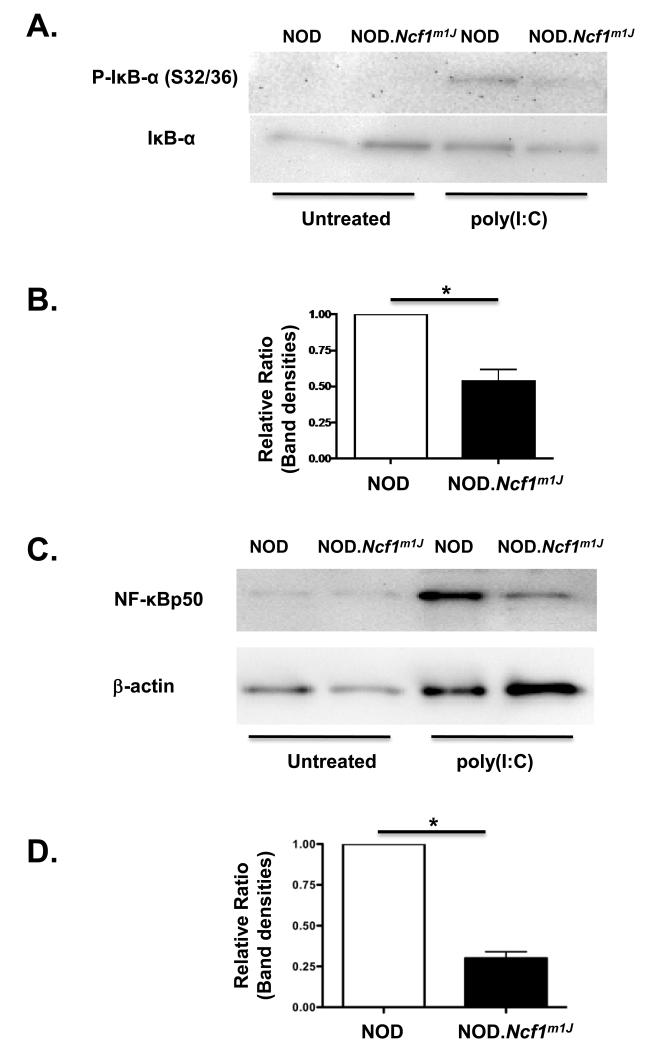
Figure 7. Impaired NF-κB activation in NOD.Ncf1m1J BM-Mϕ after poly(I:C)-stimulation.
(A) Representative Western blot of phospho-IκB-α (S32/S36) and total IκB-α from NOD and NOD.Ncf1m1J BM-Mϕ untreated or treated with 25 μg/ml of poly(I:C) for 30′. (B) Densitometry bar graph of the average of 3 independent experiments of phospho-IκB-α (S32/S36) expression in poly(I:C)-stimulated NOD and NOD.Ncf1m1J BM-Mϕ. The phospho-IκB-α (S32/S36) expression level in stimulated NOD BM-Mϕ was arbitrarily set as 1. (C) Representative Western blot of NF-κB p50 and actin from NOD and NOD.Ncf1m1J BM-Mϕ nuclear extracts after 25 μg/ml poly(I:C) treatment for 60′. (D) Densitometry bar graph of the average of 3 independent experiments of NF-κB p50 expression in poly(I:C)-stimulated NOD and NOD.Ncf1m1J BM-Mϕ. NF-κB p50 expression level in stimulated NOD BM-Mϕ was arbitrarily set as 1. The results are representative of three independent experiments. * p < 0.05 versus poly(I:C)-stimulated NOD BM-Mϕ.

