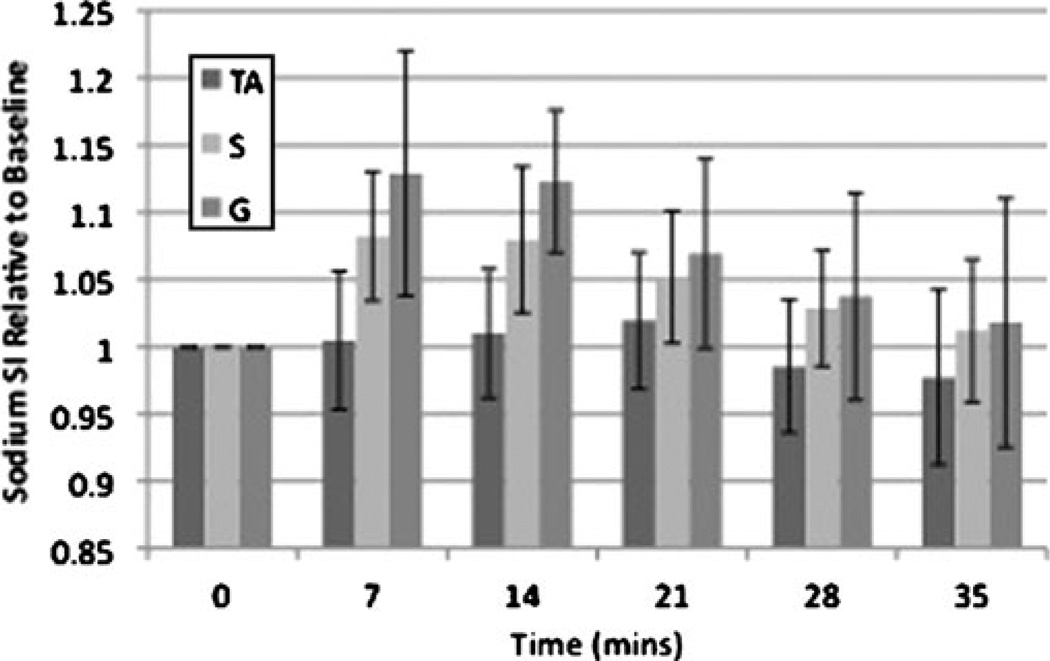
Fig. 3.
Bar graph demonstrating the time course of recovery for sodium signal intensity after exercise in healthy subjects. Immediately after exercise, sodium signal intensity increased in S (8±4%, p=0.028) and G (13±8%, p=0.028), but not in the dorsiflexor control muscle TA (0.55%, p=0.92). Sodium signal intensity then decreased to near baseline in an exponential fashion with a t1/2 of approximately 22 min for both S and G

