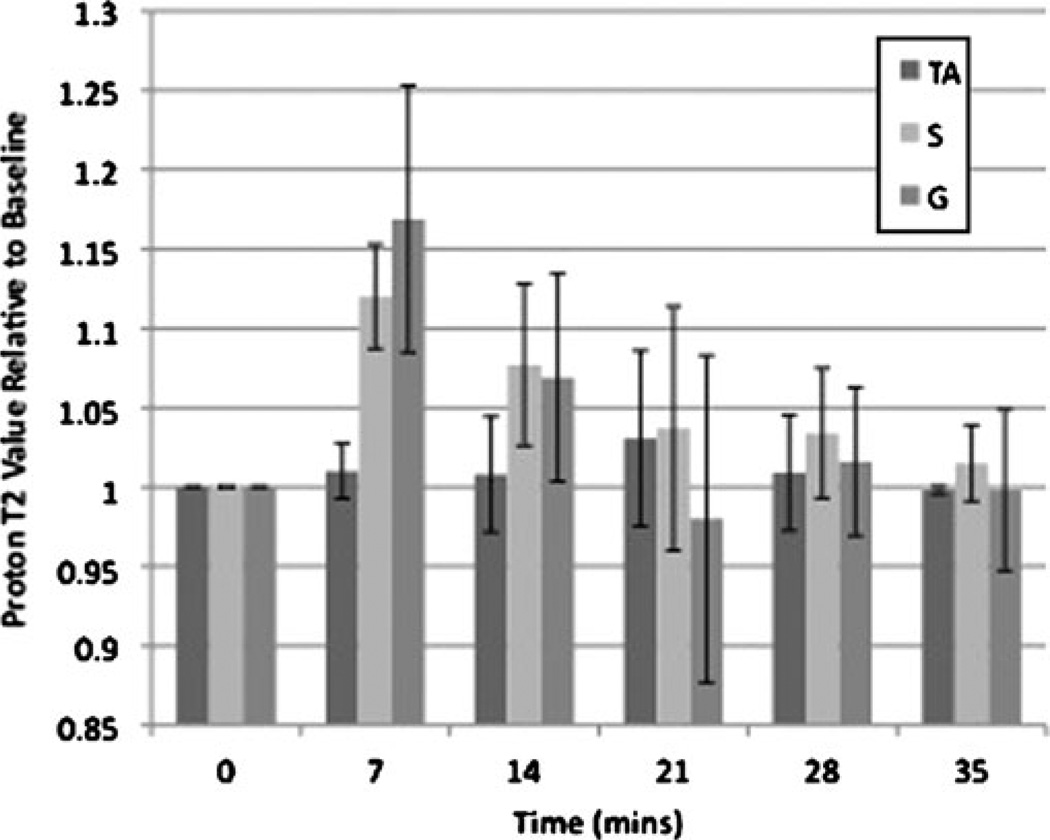
Fig. 4.
Bar graph demonstrating changes in proton T2 relaxation values before and after exercise. Baseline T2 relaxation values for tibialis anterior (TA), soleus (S) and gastrocnemius (G) were 33.9± 3.78 ms, 36.8±4.2 ms and 36.7±4.67 ms, respectively. Immediately after exercise, T2 relaxation values increased in S (12±3%, p=0.01) and G (17±8%, p=0.029), but not in TA (1±2%, p=0.18). T2 relaxation values in S and G then decreased in a logarithmic fashion with half-lives (t1/2) of approximately 15 and 12 min, respectively

