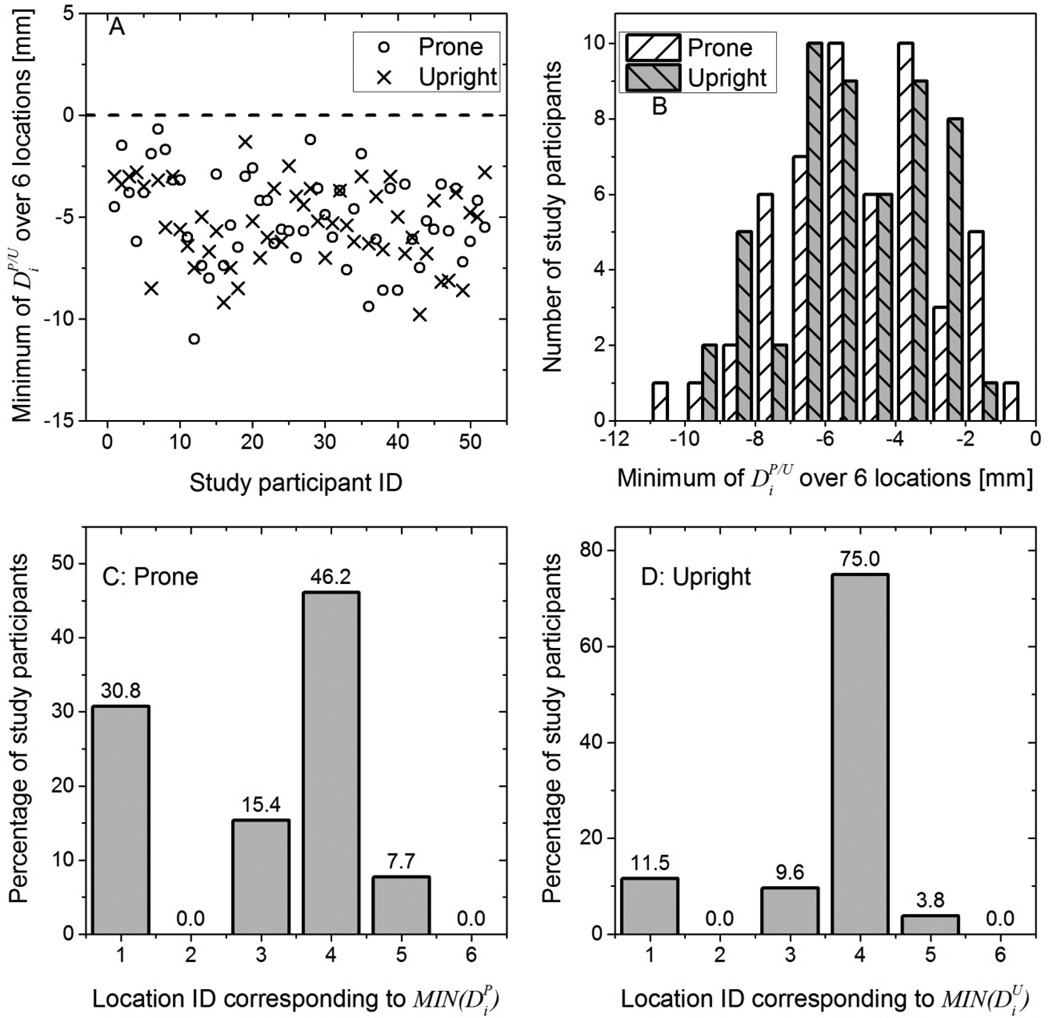
Figure 6.
In (A), the minimum of over i = 6 locations for each study participant is shown. For all study participants, was negative indicating that the skin mark from mammography was posterior to breast CT in at least one location. In (B), the histograms of are shown. At the 0.05 level, paired t-test indicated that the means of and were not statistically different. In (C) and (D), the histograms, expressed in percentage of study participants, of the location IDs corresponding to and are shown.

