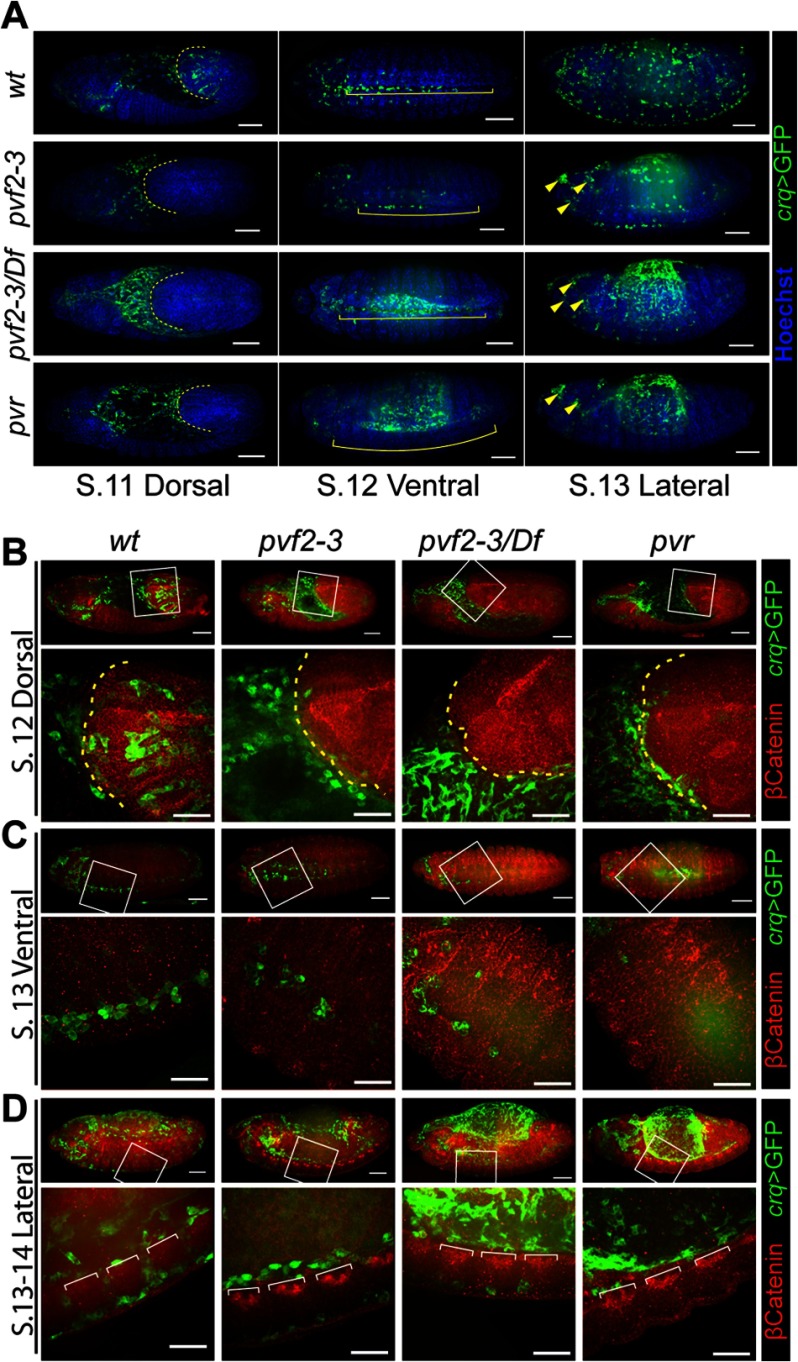
FIGURE 2.
Hematopoiesis and hemocyte migration in pvf2–3 mutants. A–D, stage 11–14 crqGAL4,UAS-eGFP/+ (wt), pvf2–3,crqGAL4/pvf2–3,UAS-eGFP (pvf2–3), UAS-mCD8-GFP;pvf2–3,crqGAL4/Df(2L)BSC291 (pvf2–3/Df), and UAS-eGFP;pvr,crqGAL4/pvr (pvr) embryos. Hemocytes were visualized by eGFP expression (green in A). All embryos were oriented with the anterior region to the left and the dorsal surface facing up. A, embryos were counterstained with Hoechst (blue in A) to visualize DNA. Scale bars represent 50 μm. Dashed yellow lines in stage 11 embryos indicate the edge of the retracting germband. Yellow brackets in stage 12 embryos indicate the ventral midline region. Yellow arrowheads in stage 13 pvf2–3, pvf2–3/Df, and the pvr mutant eGFP frame mark hemocyte clumps in the head. B–D, hemocytes were visualized by GFP expression (green in B). The adherens junction protein, Armadillo (β-Catenin), was visualized by antibody labeling (red in B). The boxed regions in the first row of each embryo are shown below at higher magnification. Scale bars represent 50 μm in whole embryo panels and 25 μm in high magnification panels. B, dashed yellow line indicates the edge of the retracting germband. D, white brackets demarcate axon bundles of the ventral nerve cord.

