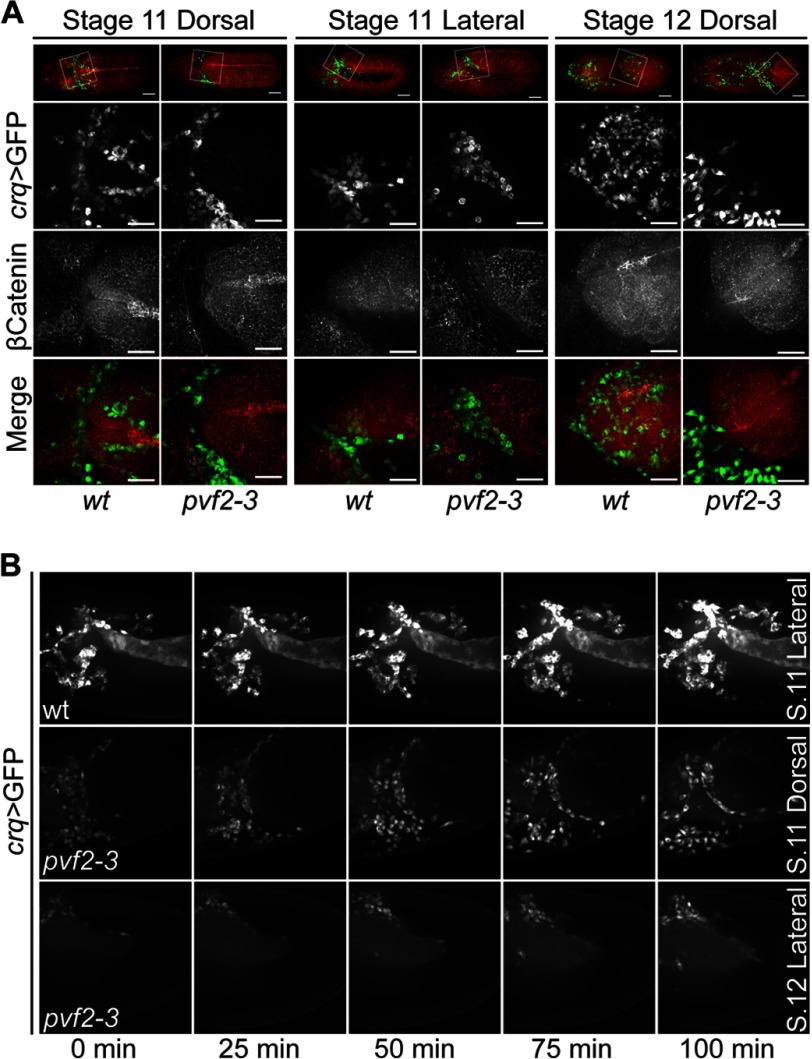
FIGURE 4.
Hemocyte invasion of the germband in pvf2–3 mutant embryos. A, stage 11–12 crqGAL4,UAS-eGFP/+ (wt) and pvf2–3,crqGAL4/pvf2–3,UAS-eGFP (pvf2–3) embryos. Hemocytes were visualized by eGFP expression (green in Merge) and Armadillo (β-Catenin) was visualized by antibody labeling (red in Merge). The boxed regions in the first row are shown at higher magnification in the second to fourth rows. Scale bars represent 50 μm in whole embryo panels and 25 μm in high magnification panels. B, individual frames from live images of wt and pvf2–3 embryos of the indicated stages and orientations. Hemocytes are visualized by eGFP expression as above. The upper panel captures germband invasion by hemocytes in wt embryos. The lower two panels show a failure of pvf2–3 hemocytes to invade the germband.

