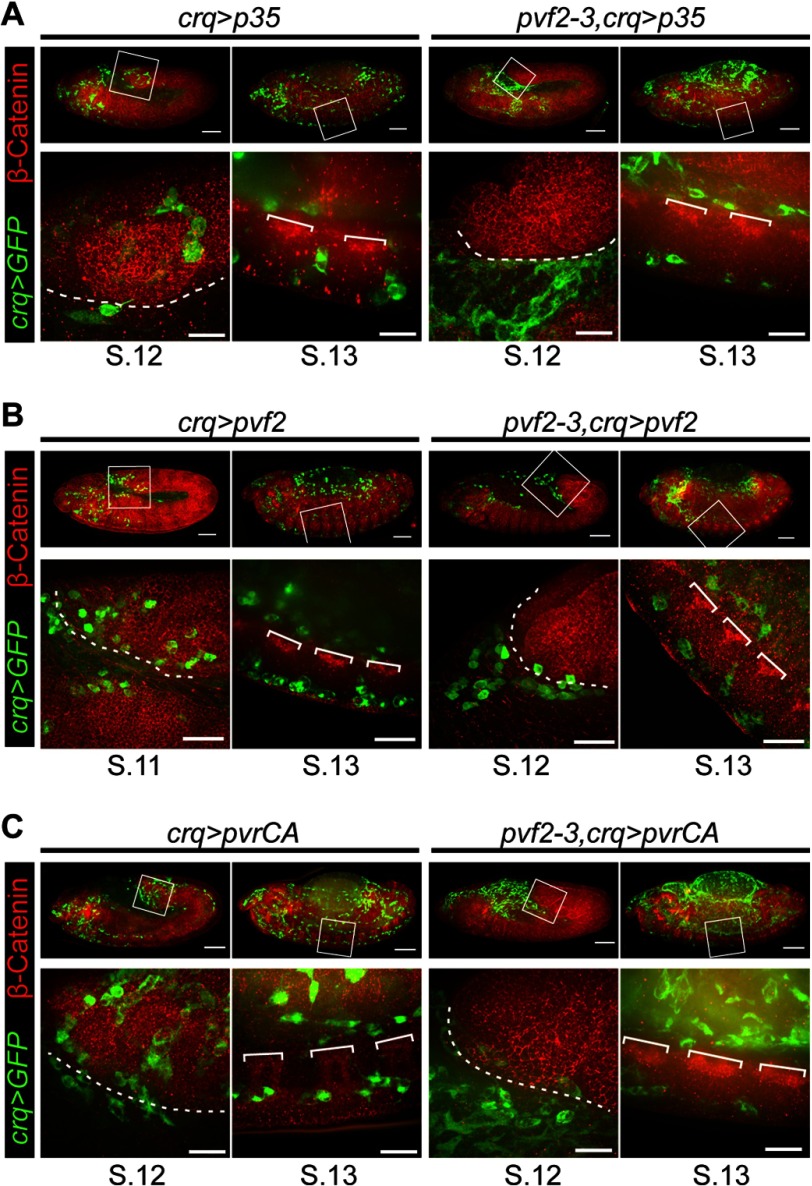
FIGURE 5.
Hemocyte migration patterns in pvf2–3 mutants that express Pvf2, a constitutively active Pvr or the pan-caspase inhibitor p35. A–C, hemocytes were visualized by eGFP expression (green) and Armadillo (β-Catenin) was visualized by antibody labeling (red). The boxed regions were visualized at higher magnification shown in the lower panel. Scale bars represent 50 μm in whole embryo panels and 15 μm in high magnification panels. The dashed white line indicates the edge of the retracting germband. White brackets demarcate axon bundles of the ventral nerve cord. A, crqGAL4,UAS-eGFP/UAS-pvf2 (crq>pvf2) and pvf2–3,crqGAL4,UAS-GFP,UAS-pvf2(pvf2–3,crq>pvf2) embryos are shown. B, crqGAL4,UAS-eGFP/UAS-pvrCA (crq>pvrCA) and UAS-mCD8-GFP/+;pvf2–3,crqGAL4/pvf2–3,UAS-pvrCA (pvf2–3,crq>pvrCA) embryos are shown. C, crqGAL4,UAS-eGFP/UAS-p35 (crq>p35) and UAS-mCD8-GFP/+;pvf2–3,crqGAL4/pvf2–3,UAS-p35 (pvf2–3,crq>p35) embryos are shown.

