
FIGURE 2.
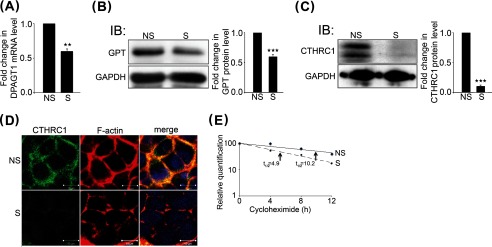
N-Glycosylation increases CTHRC1 abundance by protein stabilization. A, quantitative PCR of DPAGT1 transcript levels in NS (non-silenced) and S (DPAGT1-silenced) siRNA-transfected CAL27 cells. **, p < 0.01. B, left, immunoblot (IB) of GPT expression in NS and S siRNA-transfected CAL27 cells. Right, -fold change in GPT levels after normalization to GAPDH, ***, p < 0.001. C, left, immunoblot of CTHRC1 in NS and S siRNA-transfected CAL27 cells. Right, -fold change in CTHRC1 levels after normalization to GAPDH, ***, p < 0.001. D, immunofluorescence localization of CTHRC1 (green) and F-actin (red) in NS and S siRNA-transfected cells. E, comparison of CTHRC1 protein decay rates in NS and S (DPAGT1) siRNA-transfected cells. CAL27 cells were stimulated with conditioned medium overexpressing Wnt3a for 24 h, and total cell lysates were collected from cells grown in the presences of 20 μg/ml cycloheximide at 0, 4, 8, and 12 h.