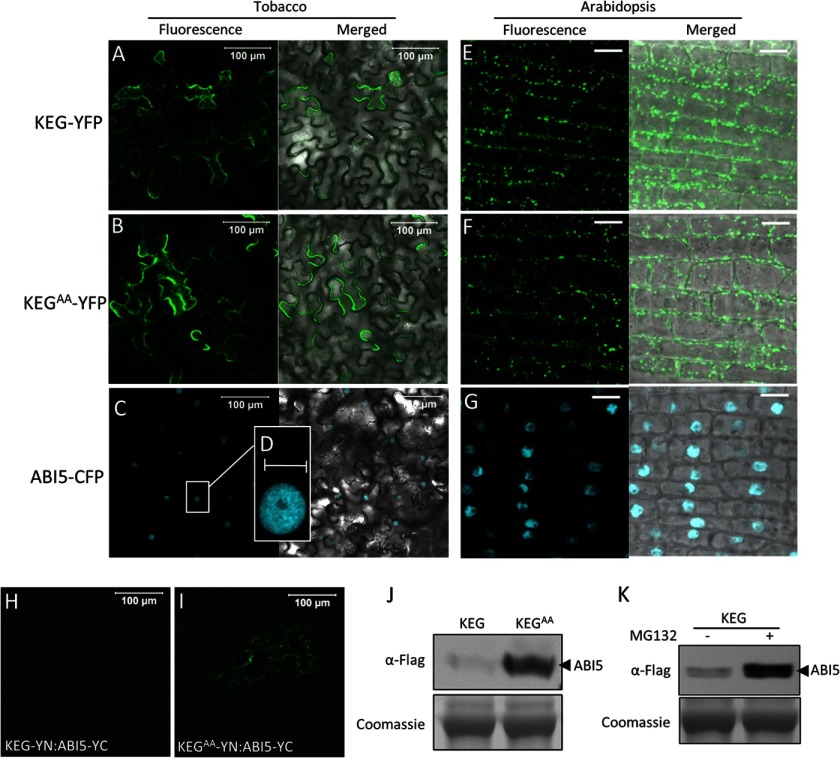
FIGURE 1.
KEG interacts with ABI5 in the cytoplasm. A–D, localization of KEG-YFP (A), KEGAA-YFP (B), and ABI5-CFP (C and D) in transiently transformed tobacco leaf epidermal cells. Right panels show fluorescence images from a combined series of Z-stack. Left panels show transmitted light images merged with fluorescence images from a single optical section. Bars = 100 μm. D displays an enlargement of the section delimited by a white square in C. Bar = 10 μm. E–G, localization of KEG-YFP (E), KEGAA-YFP (F), and ABI5-CFP (G) in root cells of transgenic Arabidopsis seedlings. Right panels show fluorescence images from a single optical section. Left panels show transmitted light images merged with fluorescence images from a single optical section. Bars = 10 μm. H and I, BiFC analysis in tobacco epidermal cells. KEG-YN (H) or KEGAA-YN (I) was coexpressed with ABI5-YC. Bars = 100 μm. J, levels of ABI5-YC following coexpression with KEG-YN or KEGAA-YN. Analysis was done using protein extracts derived from the same samples assayed for BiFC shown in H and I. K, levels of ABI5-YC in tobacco epidermal cells coexpressing KEG-YN in the absence (−) and presence (+) of MG132. Note: ABI5-YC also contains a FLAG tag. Coomassie staining was used to confirm equal loading.

