
FIGURE 7.
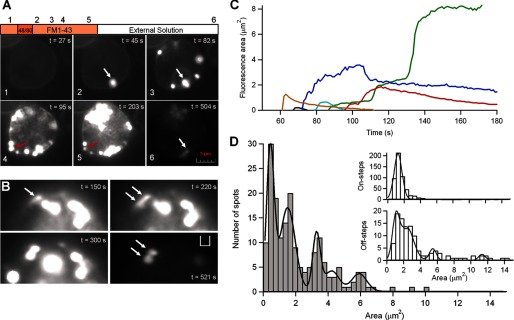
Exocytosis and endocytosis are visible using FM1-43 fluorescence. A, fluorescence images from one single cell obtained at different stages of the protocol (see “Experimental Procedures”). Panel 1, incubation in standard solution with FM1-43. Panel 2, 5 s after the application of compound 48/80, exocytosis starts. Panels 3–5, degranulation progresses; some spots abruptly can grow in size (white arrow), and others, after reaching a maximal fluorescence, start to decrease both in brightness and size (red arrow). Panel 6, after washout, the remaining fluorescence is the result of FM1-43 trapped in the fraction of membrane internalized by endocytosis and/or the FM1-43-stained dense cores retrieved by endocytosis. Scale bar, 1 μm. B, time series showing an enlarged portion of an isolated mast cell bathed in solution with 4 μm FM1-43 and stimulated with compound 48/80, as in A. One spot abruptly doubles its size after stimulation (white arrows), indicating that one granule fused to the plasma membrane, and another granule fused with that granule. After washing out the external fluorophore, the spot persisted whereas the rest of spots almost disappeared (t = 521 s). C, traces showing the fluorescence area over the time (during degranulation) of six individual spots from a single cell stimulated with compound 48/80. In this example, three spots reduced both its area and brightness below the detection threshold, suggesting release of dense cores from the fused granules, whereas three other spots were each several times bigger than the other three. The spots increased its area twice (red line), three times (blue line), or even more (green line). D, histogram of maximal area levels of 181 spots from 24 cells after stimulation with compound 48/80. The distribution is fit to multiple Gaussians (smooth line) with peaks at 0.3, 1.4, 3.1, and 5.8. As many of the spots overlapped during the onset of the degranulation, it was often impossible to discriminate when a spot grew or overlapped spacially with other different spots, so that, likely the maximal fluorescence area from each spot could be underestimated. The insets show histograms of areas corresponding to on- and off-steps events during capacitance measurements in intact mast cells stimulated with compound 48/80. The off-step histogram was fit by a set of Gaussians with peaks at 1.1, 2.4, 5.5, and 11.