FIGURE 3.
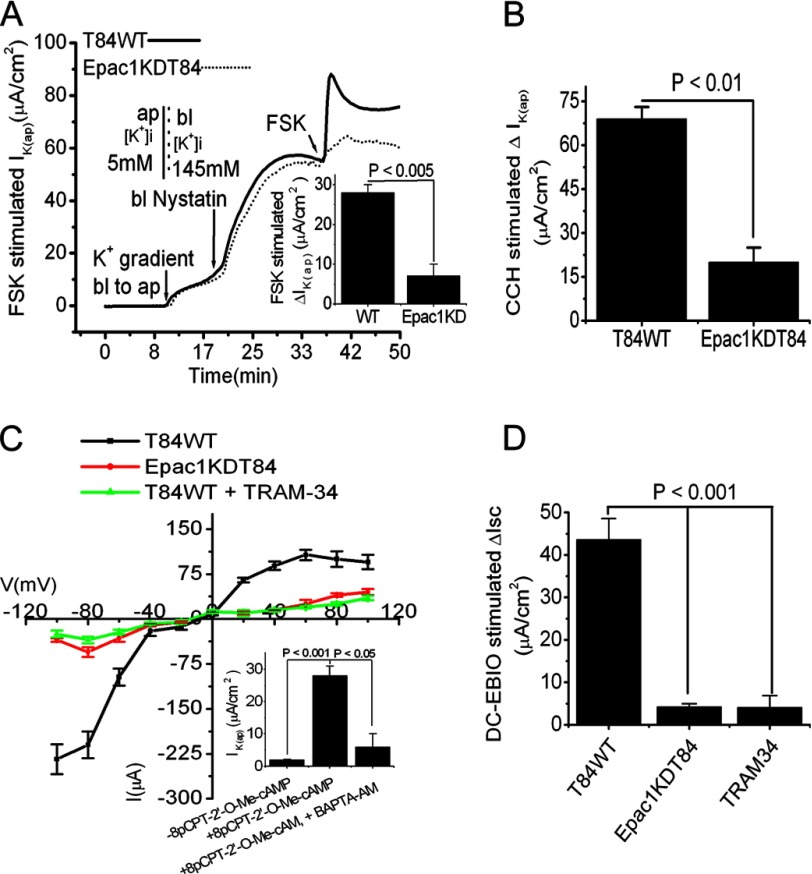
Inhibition of IK(ap) by FSK and CCH and of Isc by DC-EBIO stimulation in Epac1KDT84 cells with basolaterally permeabilized membrane. A, representative IK(ap) recordings in response to FSK (10 μm) in T84WT and Epac1KDT84 cells with imposed basolateral (145 mm) to apical (5 mm) K+ gradient. The inset shows the summary of the data from six such monolayers. Values are mean ± S.E.; n = 6. B, CCH-stimulated IK(ap) in T84WT and Epac1KDT84 cells. Values are mean ± S.E.; n = 6. C, I-V relationship in symmetric K+ concentration in the presence or absence of TRAM-34 in T84WT or Epac1KDT84 cells using the step voltage protocol described under “Materials and Methods.” The records are averaged from four independent experiments. The inset shows the stimulation of IK(ap) by 8-pCPT-2′-O-Me-cAMP in the presence or absence of BAPTA-AM. Values are mean ± S.E.; n = 4. D, effect of apical DC-EBIO (100 μm) on change in Isc in intact T84WT or Epac1KDT84 cells. T84WT cells were preincubated with or without apical TRAM-34 for 30 min; thereafter, DC-EBIO was added apically. ΔIK(ap) or Isc was derived from values before and after FSK, CCH, or DC-EBIO stimulation. Values are mean ± S.E.; n = 6. Error bars represent S.E. ap, apical; bl, basolateral.

