FIGURE 6.
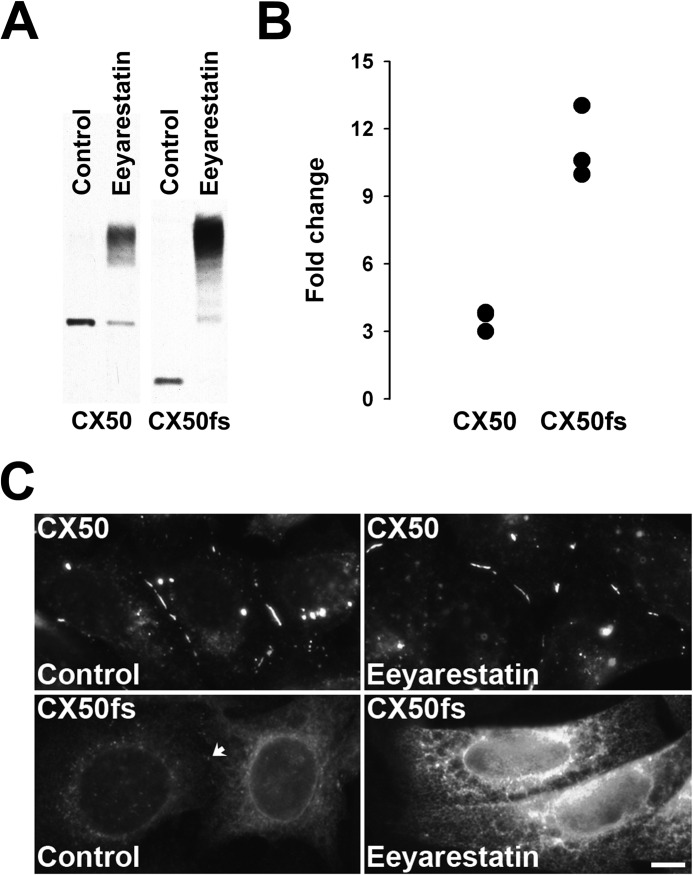
Treatment with a p97 inhibitor led to accumulation of slower migrating forms of CX50 and CX50fs. A, immunoblot shows the levels of immunoreactive CX50 in homogenates from HeLa-CX50 and HeLa-CX50fs cells treated with DMSO (solvent for eeyarestatin I) or treated with 10 μm eeyarestatin I for 8 h. Note that the CX50fs band appears almost as intense as that of wild type CX50 in the Control samples, because the CX50fs data come from a different blot with a longer exposure time of the film to chemiluminescence than the data for wild type CX50. B, graph shows the quantification of the results obtained in three independent experiments performed as described in A. For each condition, the levels of CX50 and CX50fs were quantified by densitometry. The -fold change in levels was calculated as the ratio between the densitometric values obtained after treatment with eeyarestatin I and those obtained in homogenates from DMSO-treated cultures (Control). C, photomicrographs show the distribution of CX50 and CX50fs in cells that were treated with DMSO (Control) or with 10 μm eeyarestatin I for 8 h. For either HeLa-CX50 or HeLa-CX50fs cells, the images of DMSO-treated and eeyarestatin I-treated cells were acquired with the same exposure time. The arrow points to a gap junction plaque between Control HeLa-CX50fs cells. Scale bar, 8.3 μm.

