
FIGURE 3.
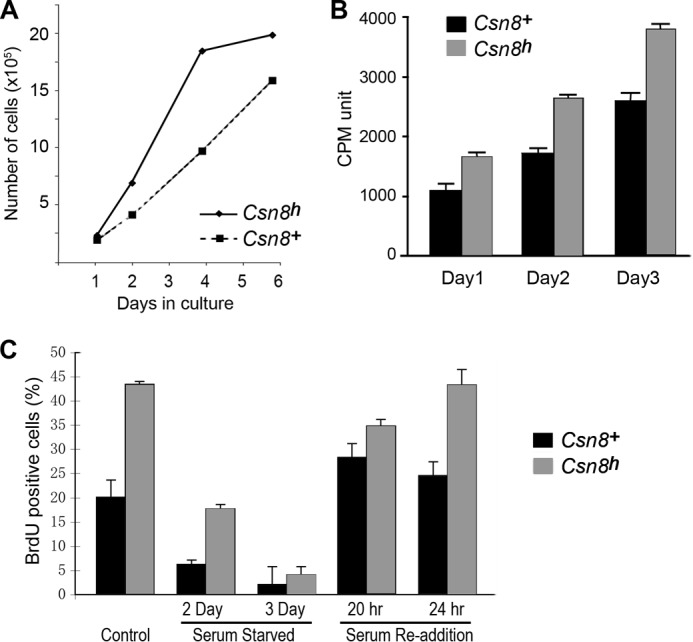
Characterization of cell proliferation properties of Csn8 hypomorphic MEFs. A, the Csn8h MEFs exhibit a faster growth rate in culture. Growth curves of Csn8h and Csn8+ control MEFs at passage 2 were measured by counting of cell numbers at the indicated days following seeding. Similar results were repeated more than four times with different MEF lines. B, the ATPLite assay was uses to compare the cell proliferation rates of the Csn8h and Csn8+ MEF cells. Experiments were repeated at least twice at different seeding densities. C, the percentage of BrdU incorporation was used to monitor proliferation of Csn8h and the Csn8+ MEFs grown under: normal growth condition (Control), serum starvation for the indicated days (Serum-Starved), and at the indicated hours after the readdition of serum following a 3-day serum starvation (Serum Re-addition). Cells were pulse-labeled with BrdU for 3 h. The Csn8+ is indicated by solid black bars, and the hypomorphic Csn8h is indicated by gray bars in both B and C. Error bars in B and C indicate S.D.