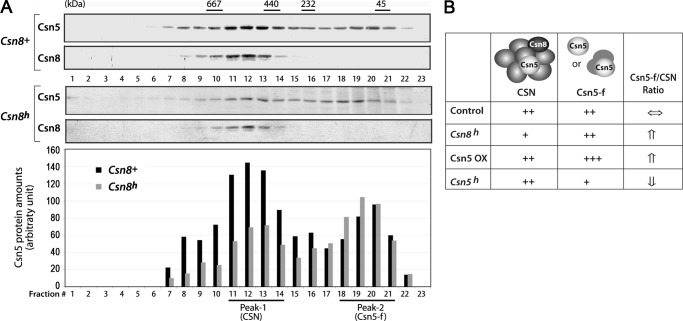
FIGURE 7.
Gel filtration analysis of relative amounts of CSN and Csn5-f form in Csn8 hypomorphic cells. A, total protein extracts from Csn8+ or Csn8h MEFs were size-fractionated in a Superose-6 gel filtration column. The fractions were analyzed by anti-Csn5 and anti-Csn8 Western blotting. Csn8 was found in large molecular weight fractions around Peak-1 (fractions 11–14), whereas Csn5 was distributed in two peaks. The low molecular weight Peak-2 (fractions 18–21) represents the Csn5-f form. The bottom panel shows the quantification of the intensity of the Csn5 bands in the Western blots above. Solid black bars indicate Csn8+, whereas the gray bars indicate Csn8h hypomorphic MEFs. B, the table qualitatively summarizes the changes in the ratio of Csn5-f/CSN in Csn8h cells (data from panel A), in comparison with the reported studies of Csn5 ectopic overexpression (Csn5 OX) and Csn5 hypomorphic cells from the literature.

