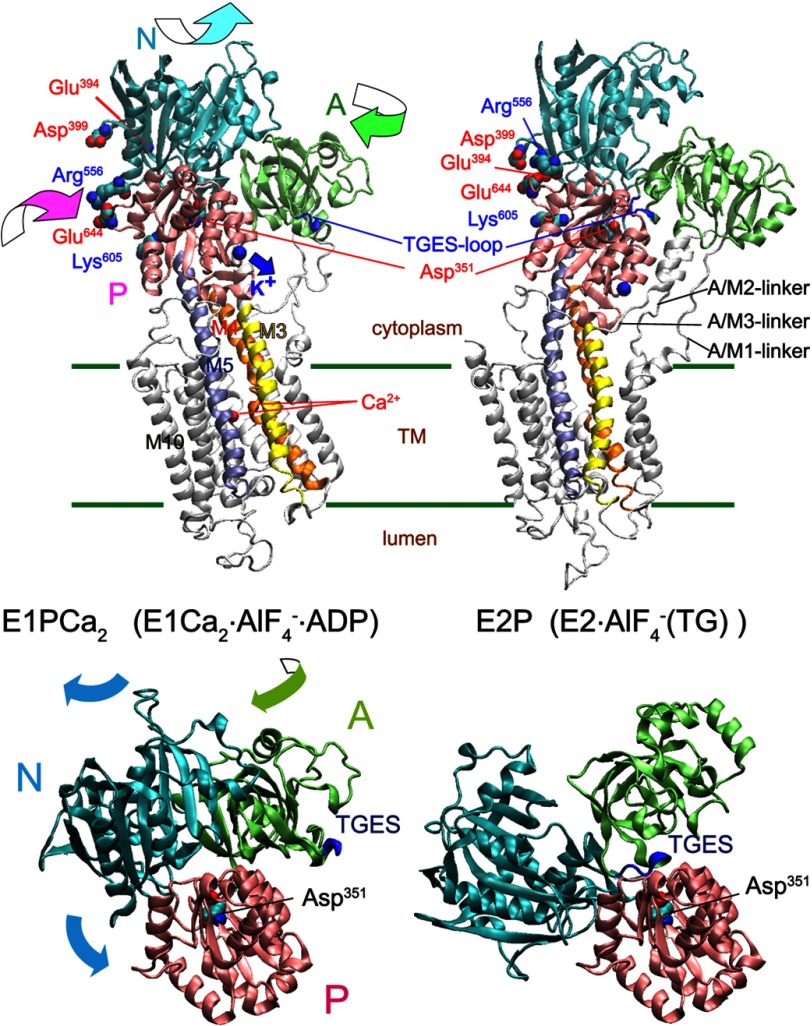
FIGURE 2.
Structural change of Ca2+-ATPase in EP transition. Upper panel, the structural change is modeled on the crystal structures with bound K+, E1Ca2·AlF4−·ADP as the E1PCa2 analog and E2·AlF4− (TG) as the E2P analog (PDB 1T5T and 1XP5 (7), respectively). The two structures are aligned with the static M8-M10 helices. The approximate position of the transmembrane region (TM) is shown by green lines. The motions of the N, P, and A domains during the EP transition are indicated by curved arrows. The autophosphorylation site (Asp351), TGES-loop of the A domain (blue loop, Thr181-Ser184 that forms the catalytic site to hydrolyze E2P), the residues explored in this study, Glu394/Asp399 forming the N-P domain long-range electrostatic interactions with Lys605, and Arg556 and Glu644 as the representative two residues at the N-P domain hinge are indicated. Note that the K+ site with bound K+ on the P domain moves down to the A/M3-linker (blue arrow), and likely cross-links the P domain with the A/M3-linker in E2P. Lower panel, the motions of the N (cyan) and A (green) domains relative to the P domain (pink) during the EP transition E1PCa2 → E2P + 2Ca2+ are shown with the curved arrows. For simplicity the transmembrane helices are not depicted, otherwise as in the upper panel.

