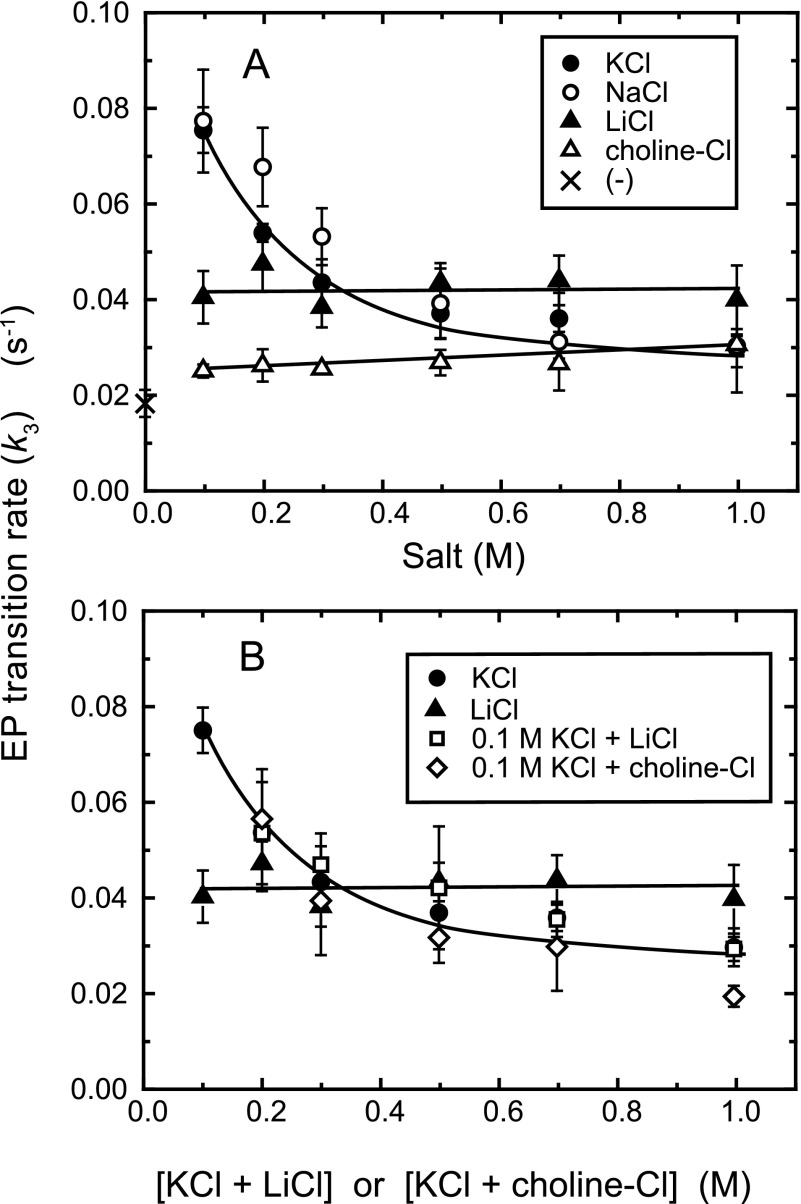
FIGURE 4.
EP transition rate k3 in various concentrations of monovalent salt. A, the rate was determined in the indicated monovalent salt or without the salts (×) as described in the legend to Fig. 3. B, the rate was determined in the presence of 0.1 m KCl plus various concentrations of LiCl or choline-Cl otherwise as above, and plotted versus the total concentration of the salts. The rates determined with KCl and LiCl in A are also plotted for comparison. The values presented are the mean ± S.D. (n = 3–5).

