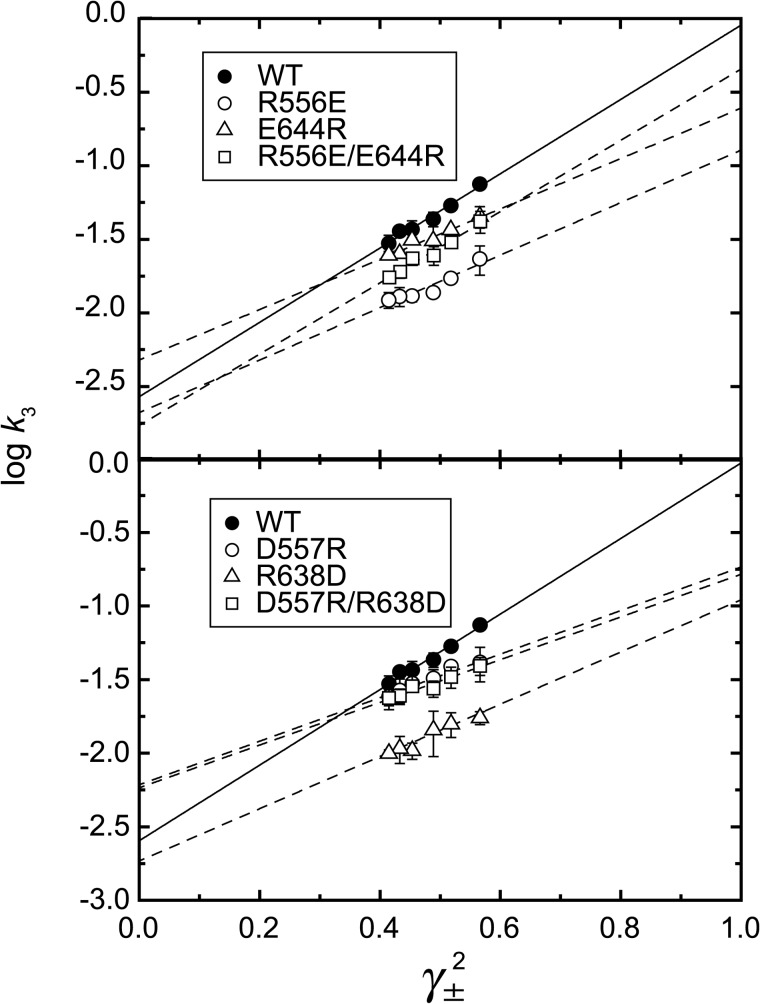
FIGURE 8.
Log k3versus γ±2 in the wild type and hinge mutants. The rates were determined in various concentrations of KCl for the wild type (WT) and the N-P domain hinge mutants as indicated, and their logarithms are plotted versus γ±2. Lines are best fit in a linear regression, and the fitting parameters are listed in Table 2. The solid lines are for the wild type. The values presented are the mean ± S.D. (n = 3–5).

