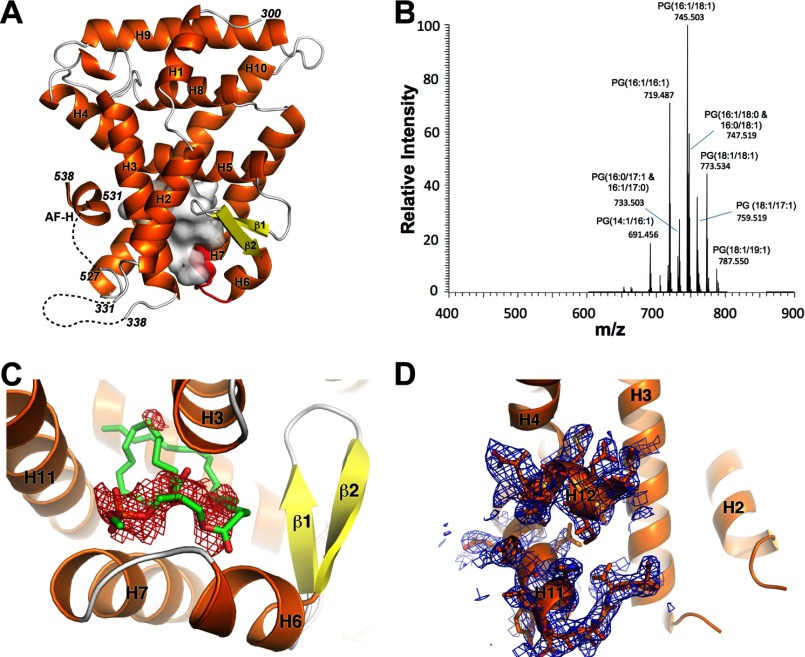
FIGURE 1.
Overall structure of apo mlLRH-1. A, graphic representation of mlLRH-1 LBD with α-helixes in orange, β-strands in yellow, and the six-residue rodent-derived amino acid replacement in red. The empty LBP cavity is depicted as a white transparent surface. Disordered residues are represented by a black dashed line. B, ESI-MS of mlLRH-1. Phospholipid peaks are labeled as PG with the acyl carbon tail lengths and unsaturation characterized by collision-induced dissociation. The y-axis is scaled relative to the most abundant peak observed in the spectra. C, Fo − Fc electron density (red) contoured at −3σ for phosphatidylethanolamine modeled into the LBP of mlLRH-1. D, 2Fo − Fc electron density contoured at 1σ showing the partially active confirmation of mlLRH-1 evidenced by the discontinuous electron density between helices 11 and 12.

