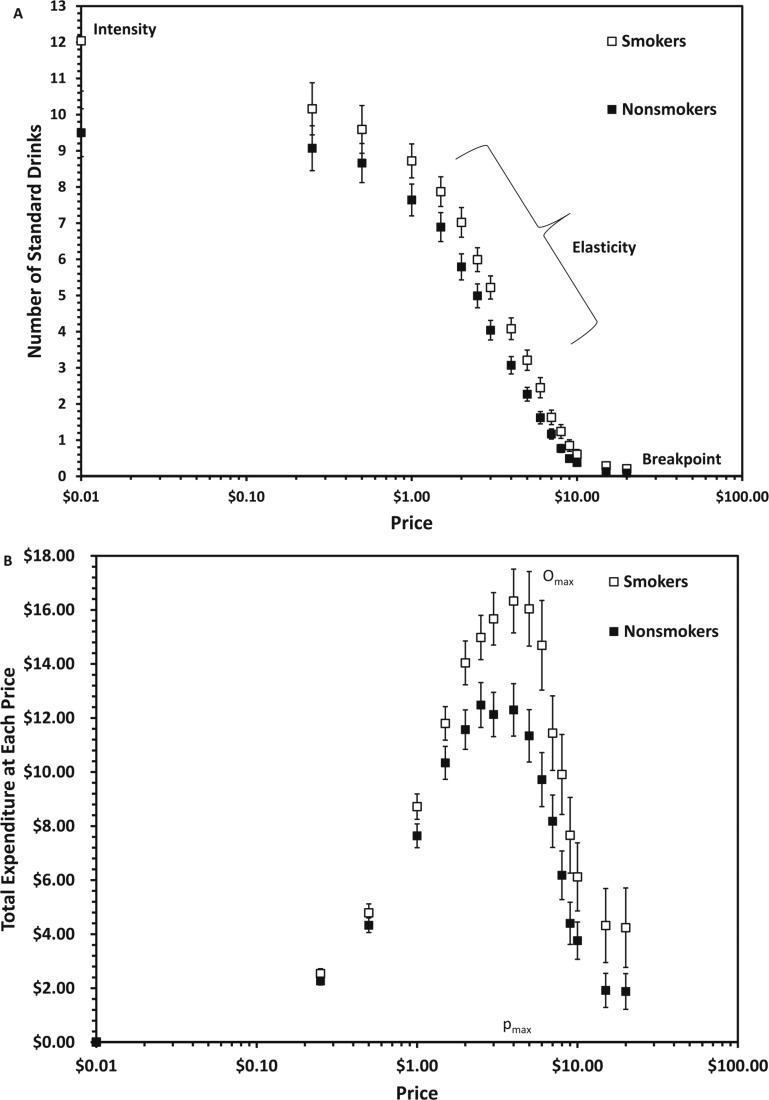
Figure 1.
Panel A depicts the mean (±1 standard error of the mean; SEM) number of drinks (hypothetical) that student smokers (n = 67) and nonsmokers (n = 140) would purchase as a function of price plotted in conventional double logarithmic coordinates for proportionality. Panel B depicts the mean (±1 SEM) expenditure on drinks (hypothetical) at each price by smokers and nonsmokers plotted in conventional double logarithmic coordinates for proportionality. The individual demand metrics also are provided: demand intensity (i.e., the peak consumption at the lowest price), elasticity (i.e., the rate of consumption reduction as a function of price), Pmax (i.e., the maximum inelastic price), Omax (i.e., the greatest expenditure on alcohol), and the breakpoint (i.e., the first price that completely suppresses consumption).

