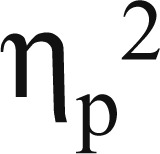
Table 3.
Estimated marginal mean scores from ANCOVAs examining alcohol demand for smokers and nonsmokers (controlling for gender, alcohol consumption, alcohol-related problems, and depression)
| Smoking status |
||||
| Demand curve metric | Smoker | Non-smoker | F(df) |  |
| Intensity | 3.03 | 2.99 | 0.116 (192) | .001 |
| Breakpoint | 3.12 | 2.83 | 4.96 (193)* | .025 |
| Omax | 4.30 | 3.96 | 3.76 (193)* | .019 |
| Pmax | 2.04 | 1.85 | 4.46 (191)* | .023 |
| Elasticity | 0.04 | 0.06 | 2.07 (149) | .014 |
Notes: ANCOVA = analysis of covariance; Omax = maximum alcohol expenditures; Pmax = maximum inelastic price.
p ≤ .05.
