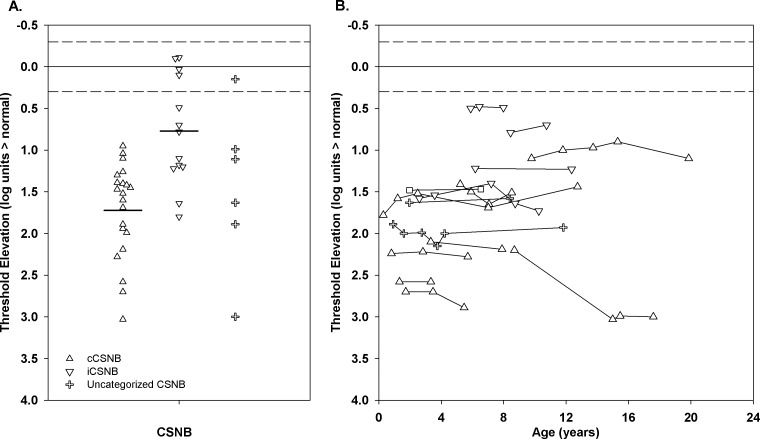
Figure 5.
(A) The first DAT measurement for cCSNB (upright triangles), iCSNB (inverted triangles), and uncategorized CSNB (plus sign). The horizontal bars indicate the means for the cCSNB and iCSNB patients. (B) DAT as a function of age for patients who were tested at least twice. In both panels, the solid line represents the mean and the dashed lines represent ±2 SD for control subjects.

