
Figure 4.
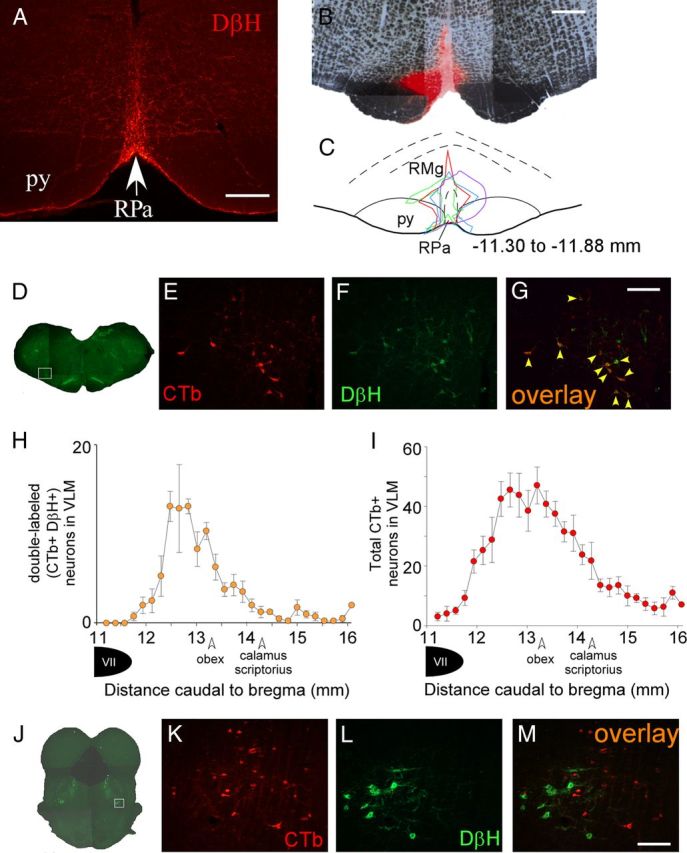
The caudal C1 area of the VLM provides the principal source of catecholaminergic input to the rRPa. A, Photomicrograph of DβH-ir highly varicose fibers in the rRPa. B, Representative example of a CTb injection site in the rRPa. C, Diagram drawing of the four CTb injection sites, each encompassing the entirety of the rRPa. Numbers represent the approximate distance caudal to bregma (Paxinos and Watson, 2007). D, Composite photomicrograph of a brainstem section representative of those in which CTb labeling was found in DβH-containing neurons in the caudal C1 region of the VLM; the white box depicts the area that is presented at higher magnification in E–G. CTb-ir neurons (red), and DβH-ir neurons (green) in the VLM and pons are illustrated in E, F, K, and L. G, Double-labeled (CTb-ir, DβH-ir) neurons (orange, indicated by yellow arrowheads) in the VLM. H, Counts (mean ± SEM, n = 4) of double-labeled neurons in the VLM with respect to the distance from bregma. I, Total number of CTb-ir neurons (mean ± SEM, n = 4) in the VLM. J, Composite photomicrograph of a pontine section through the region containing the A7 catecholaminergic cell population. The white box depicts the area presented at higher magnification in K–M. Note that there are no double labeled neurons in the pons (M). Scale bars: A, 250 μm; B, 500 μm; G (for E–G), M (for K–M), 200 μm.