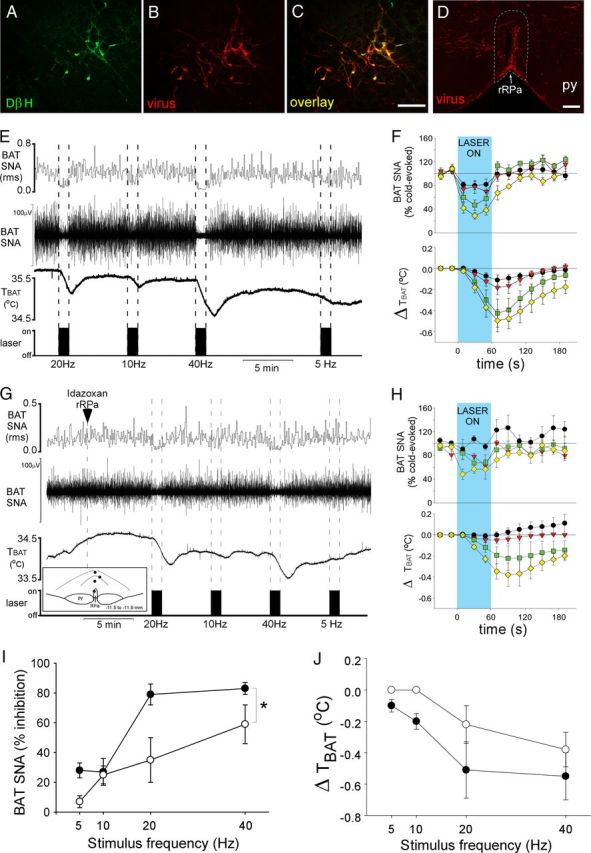
Figure 7.

Photostimulation of VLM neurons inhibits BAT SNA via activation of α2-adrenergic receptors in the rRPa. A–C, Photomicrographs of the same area of the VLM, illustrating neurons expressing DβH (green), PRSx8-ChR2-mCherry lentivirus (red), and both DβH and lentivirus (yellow). D, Photomicrograph of the rRPa (approximate borders are denoted by the white dotted line) containing highly varicose fibers expressing the lentivirus (red). E, G, BAT SNA and TBAT during photostimulation of the VLM at several stimulus frequencies before (E) and after nanoinjection of idazoxan (G) into the rRPa. G, Inset, Diagram depicts the centers of the injection sites. F, H, The group data (mean ± SEM; n = 4) of the time course of changes in BAT SNA and TBAT evoked by photostimulation (blue shaded region) at 5 Hz (black circles), 10 Hz (red triangles), 20 Hz (green squares), and 40 Hz (yellow diamonds) stimulation frequencies before (F) and after nanoinjection of idazoxan (H) in the rRPa. I, J, The photostimulation frequency response curve of the percentage of inhibition of BAT SNA (I) and the maximal change in TBAT (J) before (filled circles) and after nanoinjection of idazoxan (open circles) in rRPa. The asterisk indicates two-way repeated measures ANOVA: drug effect, p < 0.05; frequency effect, p < 0.001; and no significant interaction effect, p = 0.114. py, Pyramidal tract. Scale bars: 100 μm.
