
Figure 6.
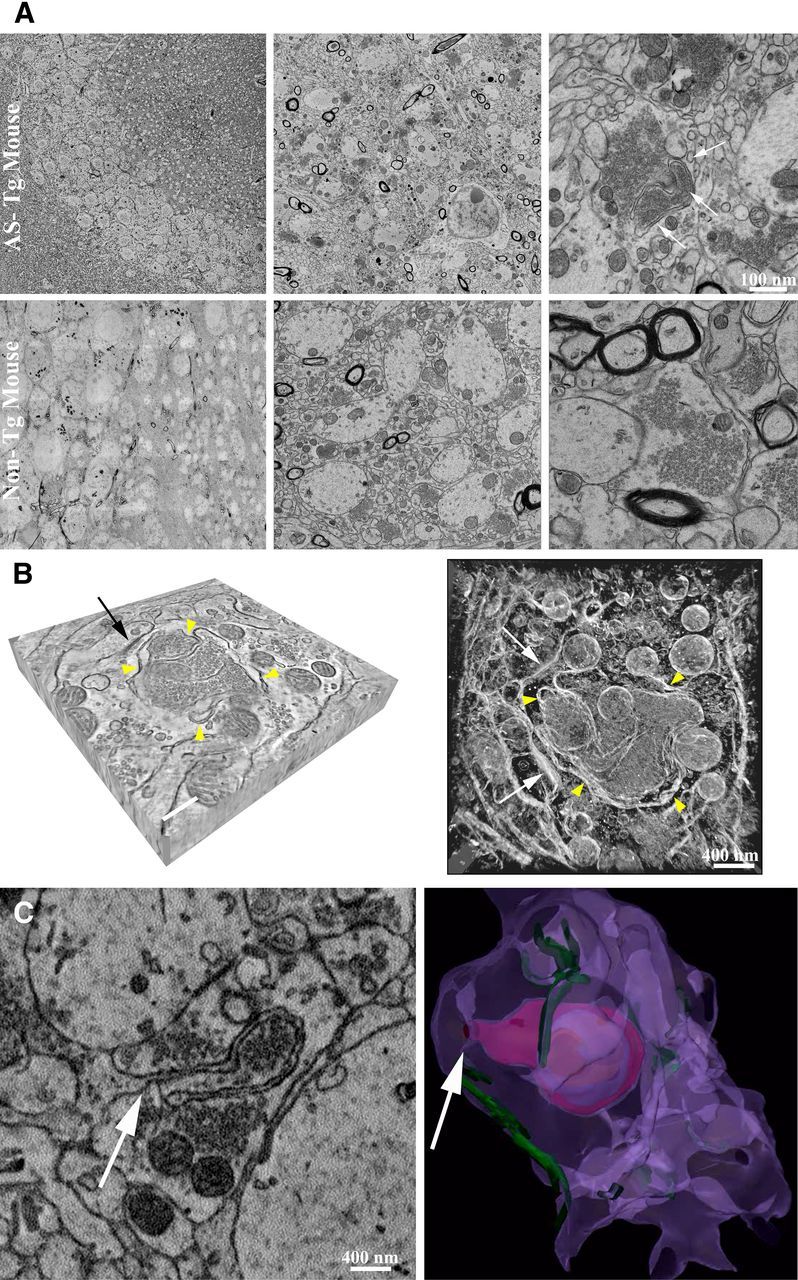
Presynaptic terminals in hippocampus CA3 of AS transgenic mice show convoluted membranous structures. A, EM analysis using TEM in hippocampus CA3 (stratum lucidum) revealed multiple-layered membrane structures in presynaptic terminals of Tg mice overexpressing human AS (top row, white arrows). The non-Tg controls (bottom row) did not show this pattern. B, Analysis of tomographic reconstruction showed that the presynaptic terminal was filled with vesicles and frequent membranous elements around them (left, yellow arrowheads in a tomographic slice). Synapse is indicated by a black arrow. Scale bar, 300 nm. On the right, maximum intensity projection of tomographic reconstruction of the same presynaptic terminal is displayed with an inverted color table (white is highest EM signal, black is no signal). Yellow arrowheads point at membrane convolutions inside the terminal. Two synapses are indicated by the white arrows. C, Using SBEM we observed that the membrane convolutions originate from invaginations of the plasma membrane, as indicated by the white arrow. Three-dimensional volume segmentation of SBEM datasets (image on the right) shows these membrane perturbations inside the complete terminal (plasma membrane is in purple, postsynaptic densities in green, membrane convolutions in magenta, blue, and orange).