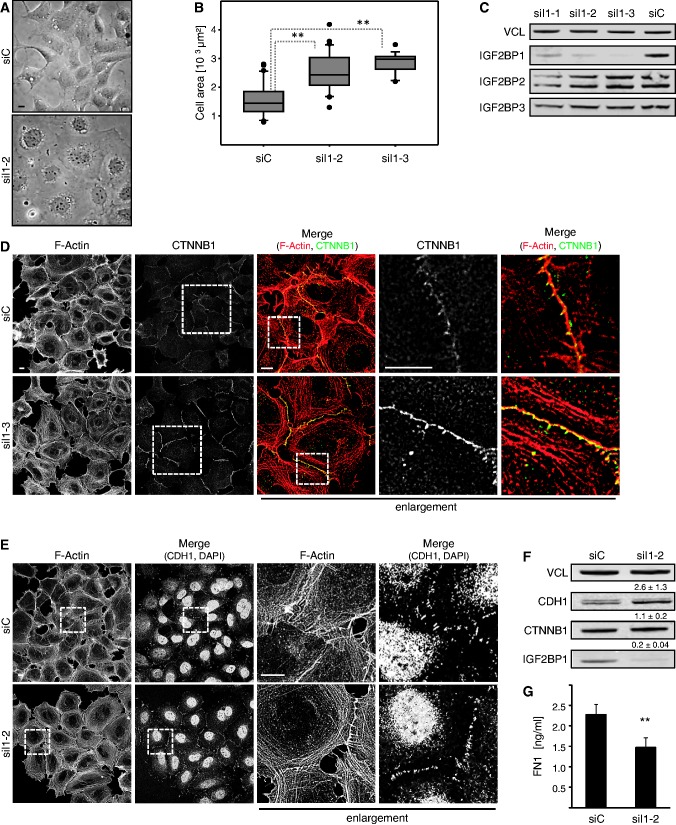
Figure 1.
IGF2BP1 knockdown promotes epithelial-like cell properties in HEK293 cells. (A and B) HEK293 cells were transfected with control (siC) or IGF2BP1-directed (siI1-2 or siI1-3) siRNAs for 72 h. Cell morphology was monitored by light microscopy (A). The size of adherent cells was analyzed on immunostaining for CTNNB1 as well as F-actin labeling by phalloidin and is depicted as box plots (B). Images were acquired by LSM microscopy. Adherent cells were traced by manual labeling using CTNNB1-defined cell borders to determine the cell area (µm2) using the Leica-SP5× software (also see Supplementary Figure S1A). (C) HEK293 cells were transfected with control (siC) or three distinct IGF2BP1-directed siRNAs (siI1-1, siI1-2 or siI1-3) for 72 h. IGF2BP1 paralogue-specific knockdown was analyzed by western blotting using IGF2BP1-, IGF2BP2- or IGF2BP3-directed monoclonal antibodies. VCL served as a loading control. (D and E) HEK293 cells were transfected with indicated siRNAs as in (A). The F-actin cytoskeleton and cell–cell contact formation was analyzed by phalloidin labeling and immunostaining for CTNNB1 (D) or CDH1 (E). Where indicated nuclei were stained by DAPI. Enlargements of boxed regions (left panels) are shown in the right panels (enlargement). Note the enrichment of CTNNB1 and CDH1 at adherens junctions and a knockdown-induced enhancement of cortical F-Actin (also see Supplementary Figure S1F). Representative images were acquired by LSM microscopy; bars, 10 µm. (F) HEK293 cells were transfected with indicated siRNAs as in (A). CDH1, CTNNB1 and IGF2BP1 protein abundance was analyzed by western blotting with indicated antibodies. Protein levels on IGF2BP1 knockdown were determined relative to controls (siC) by normalization to VCL, as indicated above panels. Representative western blots of three independent analyses are shown. (G) Soluble FN1 levels were analyzed by ELISA in HEK293 cells transfected with indicated siRNAs for 72 h. Statistical significance was validated by Student’s t-test: **P < 0.005. Error bars indicate standard deviation (SD) of at least three independent analyses.

