Figure 3.
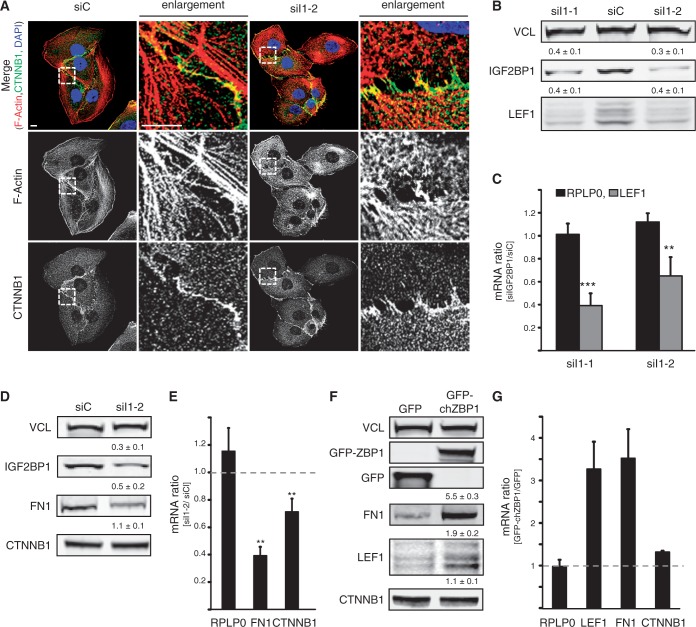
IGF2BP1 promotes the expression of LEF1 and FN1 in U2OS cells. (A) U2OS cells were transfected with IGF2BP1-directed (siI1-2) or control (siC) siRNAs for 72 h. Cell morphology and the actin cytoskeleton were analyzed by monitoring CTNNB1 localization using immunostaining or phalloidin labeling, respectively. Nuclei were labeled by DAPI. Enlargements of boxed regions (left panel) are shown in the right panels (enlargement). Bars, 10 µm. (B and C) The abundance of LEF1 protein and mRNA in response to IGF2BP1 knockdown (siI1-1 and siI1-2) was analyzed 72 h post-transfection by western blotting (B) or qRT-PCR (C), respectively. VCL served as the loading control to determine protein abundance relative to controls (siC), as is indicated above panels (B). LEF1 mRNA levels were determined relative to siC-transfected controls by the ΔΔCt-method using PPIA for normalization. RPLP0 mRNA served as a control. (D and E) FN1 and CTNNB1 protein (D) and mRNA (E) abundance was analyzed in U2OS cells 72 h post-transfection of indicated siRNAs as described in (B and C). CDH1 was not detectable in U2OS cells. (F and G) FN1, CTNNB1 and LEF1 protein (F) and mRNA (G) levels were investigated in U2OS cells stably transfected with GFP-ZBP1, the chicken ortholog of IGF2BP1 or GFP. Protein and mRNA abundance was essentially analyzed as described in (B and C). Statistical significance was determined by Student’s t-test: **P < 0.005; ***P < 0.0005. Error bars indicate SD of at least three independent analyses.

