
Figure 1.
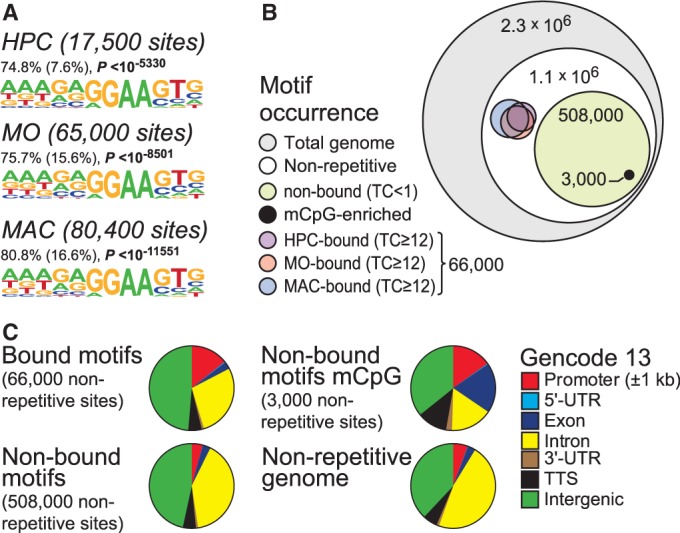
Global distribution of the PU.1 consensus motif. (A) De novo identified sequence motifs associated with PU.1 peak regions. The fraction of peak regions (200 bp) containing at least one motif instance, the expected frequency of the motif in random sequences (in parentheses), as well as P-values (hypergeometric) for the overrepresentation of each motif, are given. (B) Diagram showing the global occurrence of PU.1 consensus sites relative to the 2.1 million PU.1 consensus sites (MAC-derived motif) within the human genome (numbers indicate the sizes of motif fractions). TC, normalized tag count; mCpG-enriched, PU.1 sites that overlap with DNA methylation as detected by MCIp. (C) Pie charts showing the genomic distribution of the MAC-derived PU.1 consensus sites conditional on their binding status (bound or non-bound), as well as their DNA methylation status as detected by MCIp (non-bound motifs mCpG). A reference pie chart shows the overall proportion of different genomic elements in the non-repetitive human genome sequence. Annotation is based on GENCODE V13.