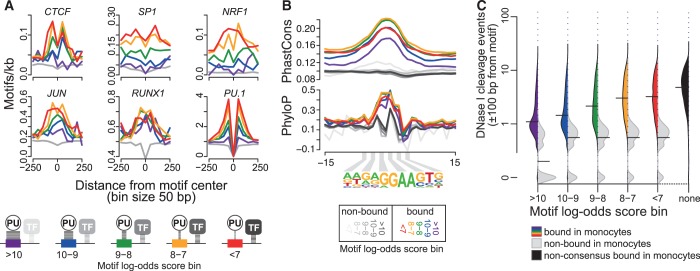
Figure 5.
Motif co-association, evolutionary conservation and chromatin accessibility in relation to motif affinity. (A) Histograms showing the distribution of indicated consensus motifs around PU.1 motifs as a function of motif scores. Motif score classes are indicated by coloring, the gray lines represent motif distributions around non-bound sites. The schematic below illustrates the inverse relationship between motif scores (affinity) and cooperativeness. (B) Histograms showing average per-nucleotide vertebrate conservation (PhastCons and PhyloP) surrounding motifs belonging to different score classes. (C) Bean plots showing the distribution of DNase I cleavage frequency around PU.1 bound (consensus site: colored filling, non-consensus sites: black filling) and non-bound motifs (gray filling) depending on motif score classes. DNase I cleavage events (at nucleotide resolution, tag counts normalized to 107) were counted in a 200-bp window around each motif. Horizontal bars mark the median of each distribution. DNase I cleavage data (representing four independent donors) were originally generated by the ENCODE or the Roadmap Epigenomics projects (for accession nos. see the Supplementary Methods). A corresponding plot for HPC is shown in Supplementary Figure S9A.

