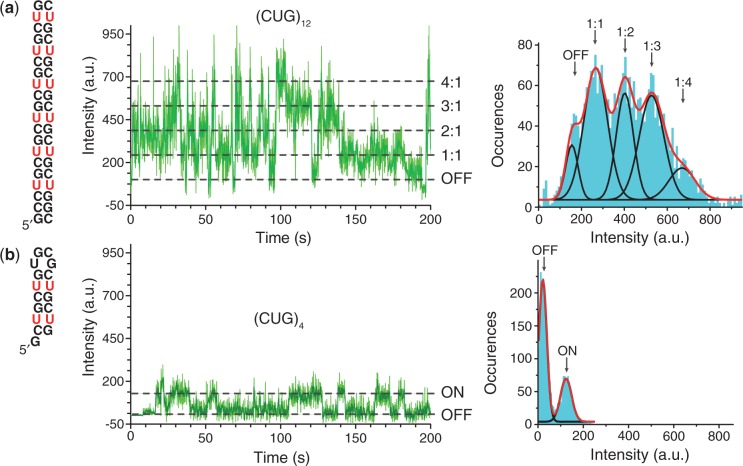
Figure 4.
Each (CUG)4 can accommodate a single-MBNL1 protein, whereas three MBNL1 proteins can be simultaneously bound to (CUG)12. (a) Schematic representation of (CUG)12 (left). (b) Schematic representation of (CUG)4. Representative fluorescence intensity trajectories for (MBNL1)3–(CUG)12 (a) and MBNL1–(CUG)4 (b) are shown in the middle (light green line shows the raw data collected at 100 ms time resolution, dark green line shows intensity averaged for nine data points). The fluorescence intensity histogram compiled from the trajectory is shown on the right (aqua) and is fit to five Gaussian peaks (black lines), corresponding to stepwise increase in (CUG)12 occupancy by MBNL1 (a), whereas only a single 1:1 binding state is observed for MBNL1–(CUG)4 (b).

