
Figure 5.
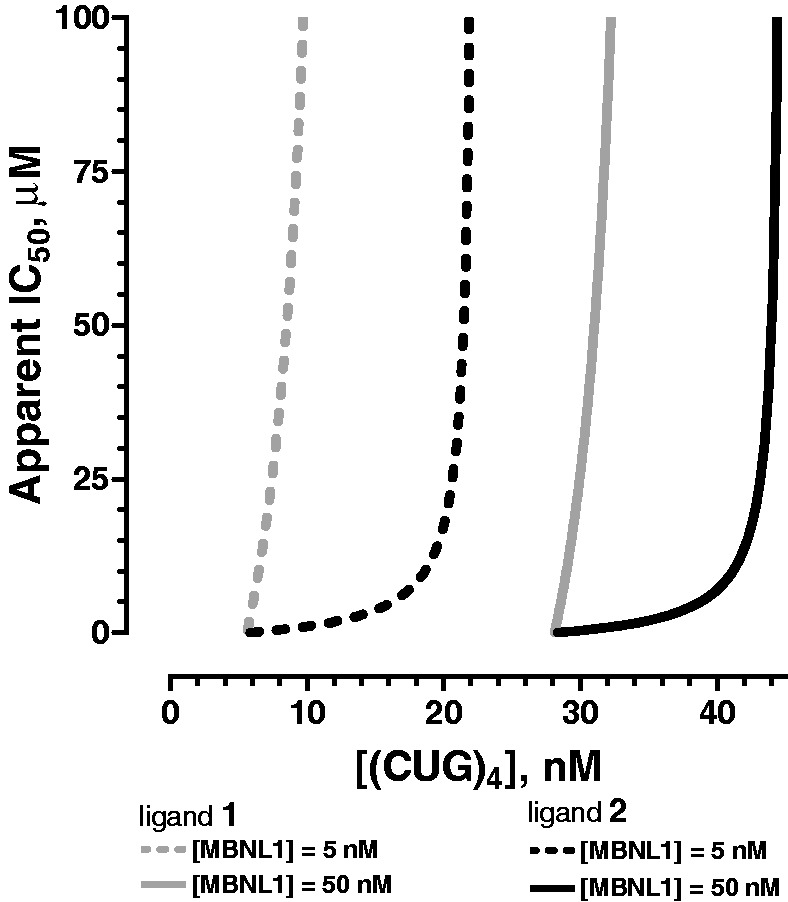
Theoretical curves for apparent IC50 values for 1 (gray) and 2 (black) at [MBNL1] = 5 (dashed lines) and 50 nM (solid lines). The concentration of ligand required to observe half of MBNL1 in the free form, IC50, depends on actual concentrations of MBNL1 and (CUG)4. The curves were generated based on the experimentally determined affinities shown in Table 1.