Figure 7.
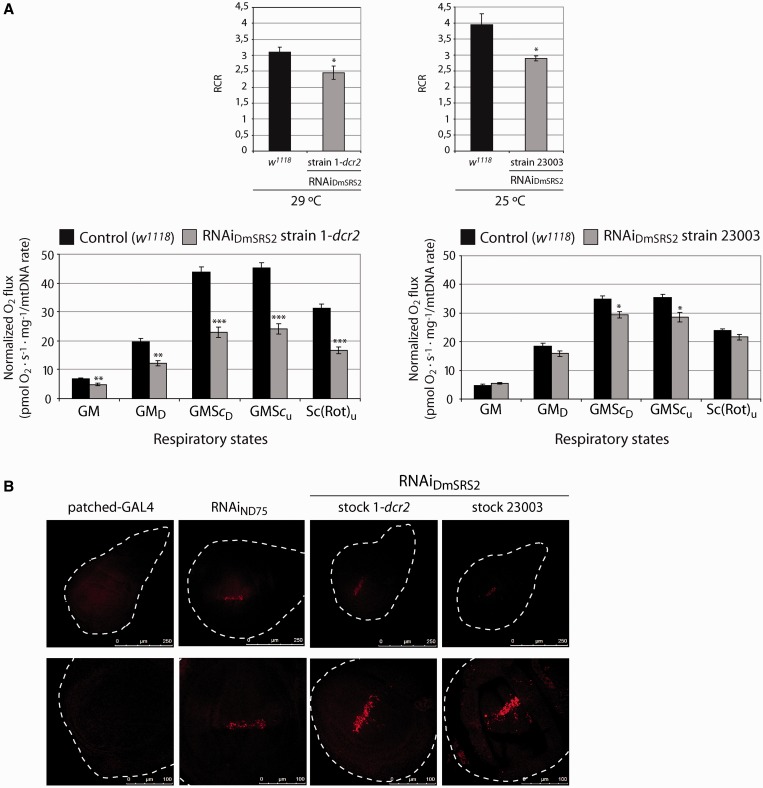
RNAiDmSRS2 effect in mitochondrial function. (A) Upper graphs represent the complex I RCRs (state 3 GMD/state 2 GM oxygen consumption) of mitochondria from larvae emerging from the crosses between actin5C-GAL4 and RNAiDmSRS2 strain 1-dcr2 or strain 23003 at 29 and 25°C, respectively, compared with that from control (w1118) at the corresponding temperature. Average RCRs are calculated using oxygen consumption values. Lower graphs show the mitochondrial oxygen consumption profile from larvae under constitutive and ubiquitous induction of RNAiDmSRS2. Values normalized by mitochondrial density show a decrease in the mitochondrial respiration for RNAiDmSRS2 strain 1-dcr2 and 23003. Graphs give the mean of oxygen flux determinations from more than three experiments with SEM (*P < 0.05, **P < 0.01, ***P < 0.001). (B) Confocal sections of wing imaginal discs from parental larvae or larvae emerging from patched-GAL4 crossed at 29°C with the two RNAiDmSRS2 strains and with an RNAiND75 strain, used as positive control (56). Cells located in the zone where RNAi is restricted show an increase in fluorescence, which indicates the accumulation of superoxide anion. Upper images show a general view and lower images focus on the affected zones (scale bars correspond to 250 and 100 μm, respectively).

