Figure 6.
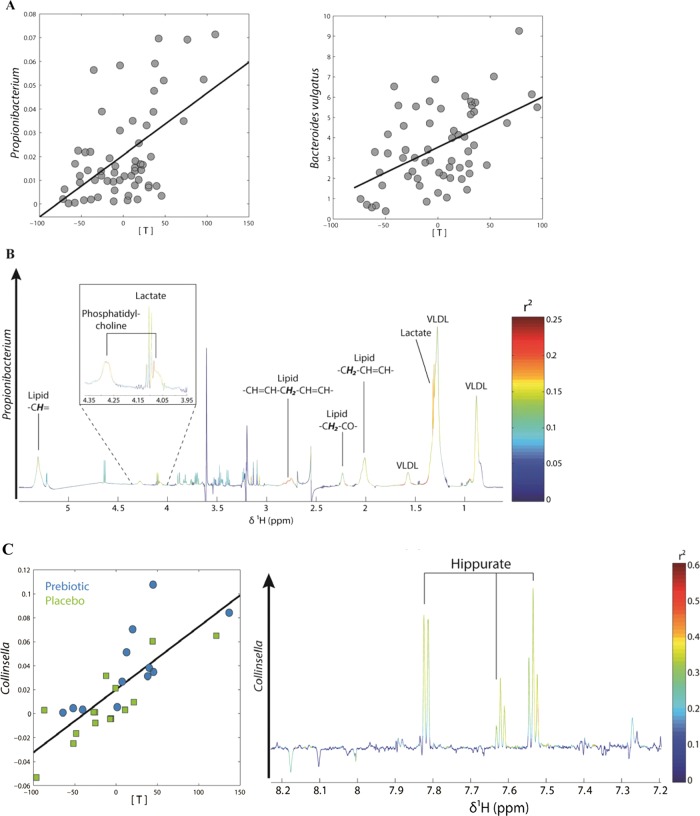
(A) Partial least square (PLS) regression analysis between plasma metabolic profiles and gut levels of Propionibacterium and Bacteroides vulgatus: score plots showing the correlation between bacterial levels (relative contribution: y axis) and PLS scores (x axis). (B) PLS loading plot for Propionibacterium showing the contribution of plasma lactate and phosphatidylcholine to the model. (C) PLS regression analysis between changes in urinary metabolic profiles and changes in the gut levels of Collinsella performed on differential values (T3 months–T0). Left: PLS scores (x axis) are plotted against Collinsella levels (relative contribution: y axis). Right: PLS loading plot showing the contribution of hippurate to the model. Details of model parameters are described in the online supplemental methods section.

