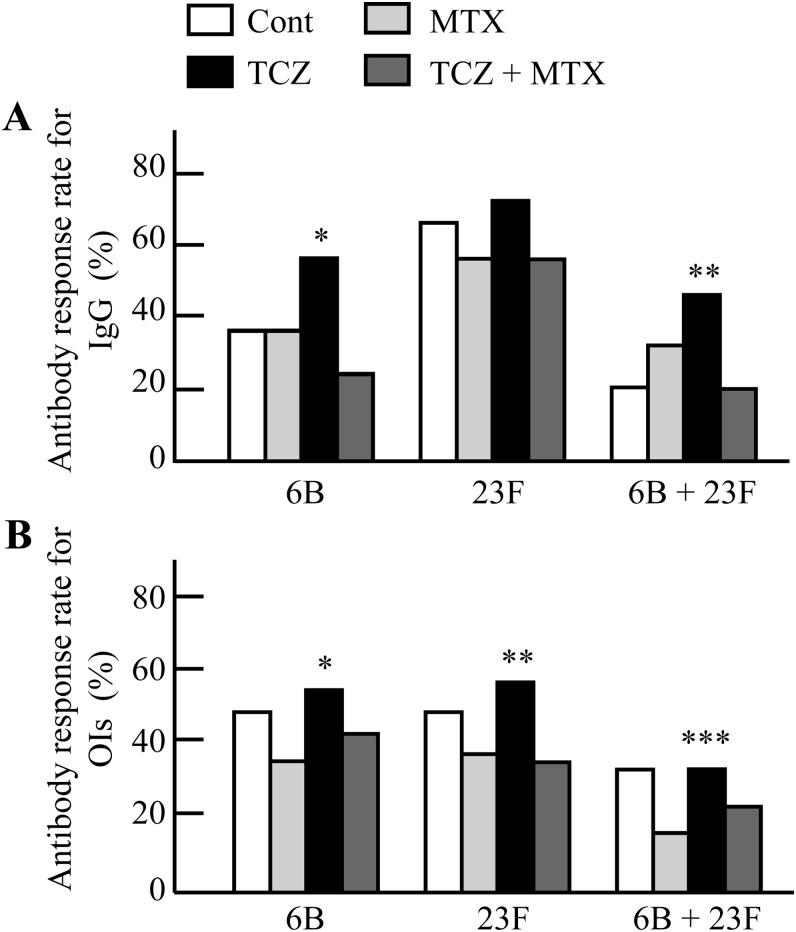
Figure 1.
(A) Percentages of patients with twofold or more increases in serotype-specific IgG concentrations for serotypes 6B and 23F in the rheumatoid arthritis (RA) treatment groups. *p=0.046 (TCZ vs MTX) and p=0.0009 (TCZ vs TCZ+MTX). **p=0.005 (TCZ vs TCZ+MTX) and p=0.044 (TCZ vs Cont). (B) Percentages of patients with 10-fold or more increases in OIs for serotypes 6B and 23F in the RA treatment groups. *p=0.019 (TCZ vs MTX). **p=0.027 (TCZ vs MTX) and p=0.020 (TCZ vs TCZ+MTX). ***p=0.028 (TCZ vs MTX). Data were compared using the χ2 test or Fisher's exact probability test. OIs, opsonisation indices; Cont, RA control group; MTX, methotrexate group; TCZ, tocilizumab group; TCZ+MTX, combination therapy group.

