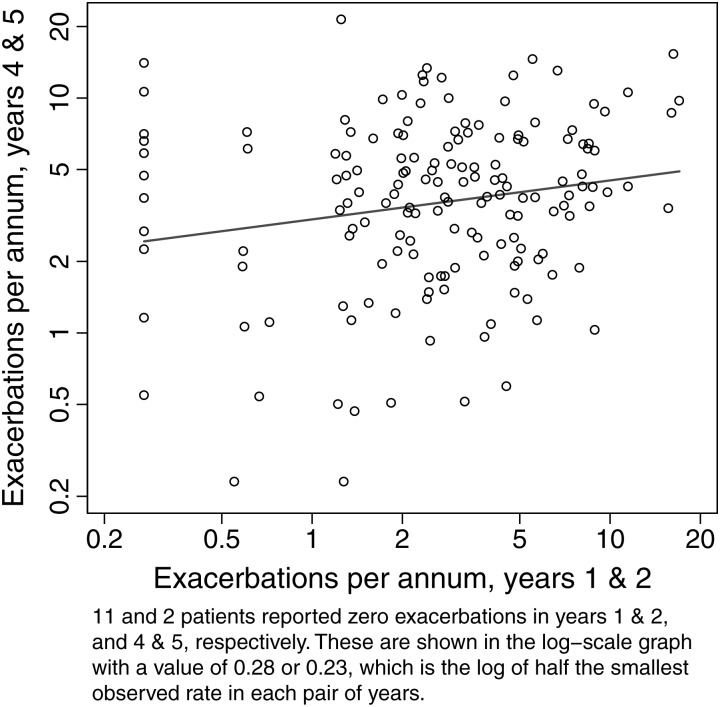
Figure 3.
Rate of respiratory exacerbations in years 4 and 5 versus years 1 and 2 of life. Eleven and two patients reported 0 exacerbations in years 1 and 2, and 4 and 5, respectively. These are shown in the log-scale graph with a value of 0.28 or 0.23, which is the log of half the smallest observed rate in each pair of years.

