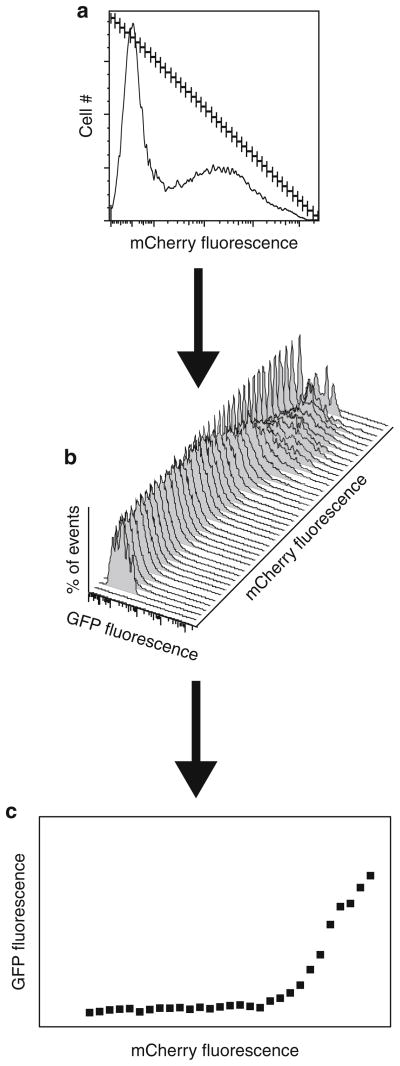
Fig. 2.
Assaying UPS-GFP reporter levels in cells transfected with an mCherry-tagged protein according to levels of mCherry expression. (a ) Histogram displaying frequency distribution as a function of mCherry fluorescence. The mCherry axis has been split into a series of gates of equal width. (b) Histograms displaying frequency distribution (Y-axis) of UPS-GFP fluorescence intensities (X-axis) of cells in each gated mCherry population (Z-axis). (c) X–Y scatter plot displaying the relationship between the level of the overexpressed protein and UPS impairment. The compensated mean GFP fluorescence intensity for each mCherry gate is plotted on the Y-axis versus the gate number on the X-axis.

